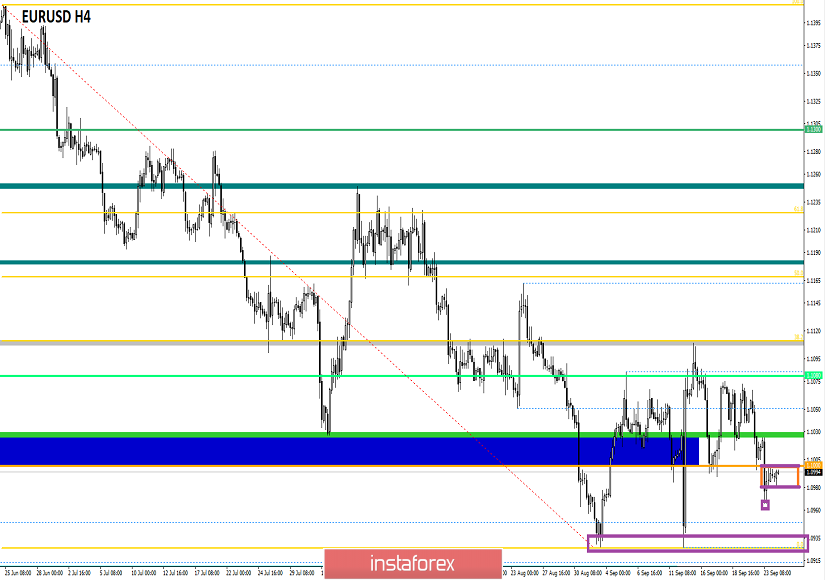
The euro/dollar currency pair for the last trading day showed volatility equal to the daily average of 59, resulting in the formation of a local cross with a subsequent rollback. From technical analysis, we see that the local surge led to the fact that the quote managed to break through the psychological level of 1.1000, but then the recovery process began, rolling the quotation back to the previously passed level. There is a judgment among traders that such an oscillation is probably a pattern of "Breakout/Rollback", which may result in amplification followed by the resumption of the move.
As discussed in the previous review, speculators last week were calculating the options for an impulse flight within the level of 1.1000, where positions for sale were probably exposed to many, followed by profit-taking. Further actions and consequences are described yesterday, and, in principle, expectations came true. Stagnation/rollback – this is what we were waiting for after the impulse move, a maneuver of accumulation, which is not a bad sign in the market.
Looking at the trading chart in general terms (daily period), we see that the quote is trying hard to restore the downward interest, being within 75% of working out the entire width of the protracted correction. The oscillation of the past three weeks began as a systematic corrective movement, but the process was delayed so much that in the end, we got a kind of horizontal movement with points: 1.0927 – base; 1.1000 – psychological/mirror coordinates; 1.1080 (1.1115) – ceiling.
The news background of the last day was really strong and the defeat of the single currency began in the morning when the preliminary data of the German PMI came out. The index of business activity in the manufacturing sector from Markit came out with a stunning decline of 43.5 – 41.5, then finished off the index of business activity in the services sector from Markit, where it fell from 54.8 to 52.5. When the European PMI totals were published, everything was clear and the euro was already at the bottom. Then came similar PMI data, but for the United States, where it was the opposite. The indices came out very well, the composite index of business activity shows an increase from 50.7 to 51.0 and the services sector growth from 50.7 to 50.9. The question arises about which recession in the States everyone is afraid of when such positive data comes out.
In turn, US President Donald Trump tweeted criticism of the Federal Reserve, calling for interest rates to be reduced to below zero.
"We always have to pay less than others!", – Twitter @realDonaldTrump
The information background managed to support the interest of speculators. Yesterday, ECB head Mario Draghi spoke in the European Parliament, where he warned that the decline in the manufacturing sector of the eurozone risks spreading to other sectors of the economy if it continues.
"While the eurozone's services sector remains resilient, we should not be complacent about its ability to remain resilient to negative impacts," the ECB chief said.
At the same time, Mario Draghi veiled that the regulator is ready for further rate cuts – "We are still ready to adjust our instruments if it is justified by the prospect of inflation."
Today, in terms of the economic calendar, there is a clear lack of news, there are no strong statistics, the only thing you can pay attention to is the composite index of housing costs S&P/CS Composite-20, which is expected to accelerate from 2.1% to 2.2%. Statistical data for Europe is not expected, a variable information background regarding Brexit is possible.
Further development
Analyzing the current trading chart, we see that the pullback returned the quote to the psychological level of 1.1000, where a stagnation was formed within 1.0980/1.1000. The theory of the "Breakout/Rollback" method is still preserved, and many traders hope for it. Speculators, in turn, lay low, tracking the behavior of quotes in the existing stagnation, as in the case of fixing the price below 1.0980, we quickly go down to the level of 1.0966, and another picture of actions is already possible there.
It is likely to assume that for some time the turbulence in the narrow range of 1.0980/1.1000 will persist, but I assume that today the boundaries will fall. We will see a local surge or a full-fledged incipient move.
Based on the above information, we will derive trading recommendations:
- We consider the buy positions in case of fixing the price higher than 1.1000 (not a puncture shadow).
- We consider selling positions in two versions: first, in the case of fixing the price lower than 1.0980, with the prospect of a move to 1.0966; the second option – we are waiting for a clear fixation of the price below the local minimum of 1.0966 yesterday. As we can see, these two options become clear that they are a single system to minimize risk.
Technical analysis
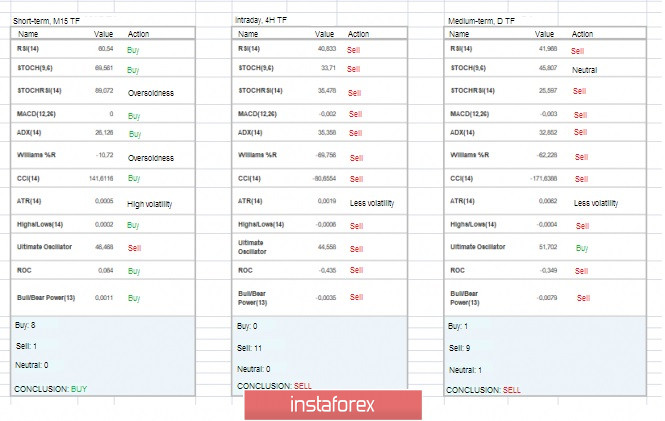
Analyzing different sector timeframes (TF), we see that the indicators, in general, signal the prevailing downward interest. The short-term period is under the interaction of the current accumulation, exhibit variable interest.
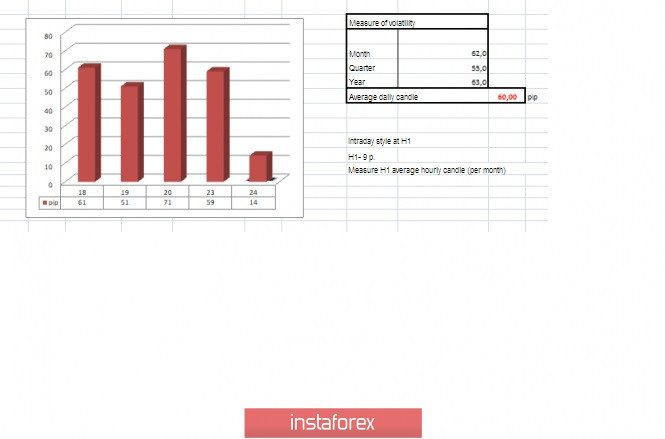
Volatility per week / Measurement of volatility: Month; Quarter; Year.
Measurement of volatility reflects the average daily fluctuation, calculated for the Month / Quarter / Year.
(September 24 was built taking into account the time of publication of the article)
The volatility of the current time is 14 points, which is extremely low for this period. It is likely to assume that the quote has yet to accelerate, but whether the forces of market participants to disperse us beyond the daily average remains a question.
Key level
Resistance zones: 1.1000***; 1.1100**; 1.1180*; 1.1300**; 1.1450; 1.1550; 1.1650*; 1.1720**; 1.1850**; 1.2100
Support zones: 1.0926*; 1.0850**; 1.0500***; 1.0350**; 1.0000***.
* Periodic level
** Range level
*** Psychological level
**** The article is based on the principle of conducting transactions, with daily adjustments.