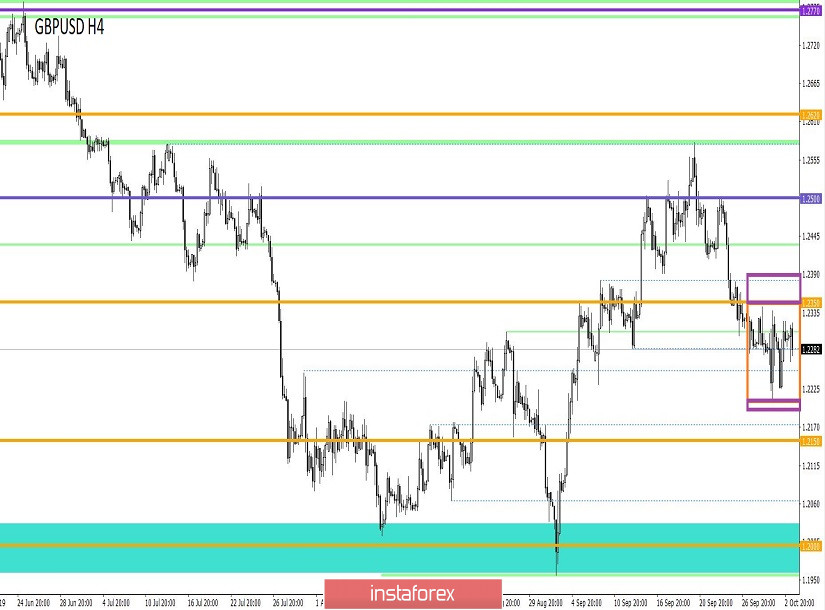
Over the last trading day, the pound/dollar currency pair showed moderate volatility within the daily average, but no drastic changes were recorded. From the point of view of technical analysis, we see that the accumulation process (1.2270/1.2350) remains on the market. In fact, the horizontal movement has been held for five trading days, which is good in some ways, but also bad at the same time. The accumulation process does not fully enter the market, but like any stagnation, it attracts attention, which can result in a good impulse move, for which many are preparing.
As discussed in the previous review, traders are divided into several factions, some continue to hold short positions, with the prospect of further decline. Others, on the contrary, liquidated all the earlier opening of the transaction, waiting for a clear change in accumulation outside the market.
Looking at the trading chart in general terms (daily period), we see the recovery process with respect to the elongated correction, where the last three candles reflect the current accumulation. It is worth noting that the recent candles are expressed in the form of a "Dodge", which signals uncertainty.
The news background of the last day had the index of business activity in the construction sector of the UK, where they expected the preservation of the current level of 45.0, but as a result, they got a reduction to 43.3. After that, the ADP report on the level of employment in the private sector of the United States was published, and this is a more interesting development. So, as if from the report, employment was expected to decrease, but as a result, the previous data was revised for the worse 195K – 157K and the current data came out even worse than the forecast of 135K. How did the dollar react to all this in terms of the GBPUSD pair? In principle, nothing, a local weakening, but within the existing accumulation.
The information background continues to work on the previously published Brexit settlement plan. Yesterday, during a telephone conversation, the head of the European Commission Jean-Claude Juncker welcomed the determination of Boris Johnson, but still noticed that in the proposals of Britain on its withdrawal from the European Union, there are problems and they needed to be improved. In the coming days, meetings of negotiating groups will be held in Brussels, where Jean-Claude Juncker will also talk with Irish Prime Minister Leo Varadkar to hear his opinion.
In turn, Prime Minister Boris Johnson will present his new Brexit proposals to Parliament on October 3. EU ambassadors will also discuss the proposals this afternoon.
Today, in terms of the economic calendar, data have already been released on the index of business activity in the UK services sector, where a decrease from 50.6 to 49.5 was recorded. In the afternoon, a similar PMI will be published, but in the United States, where they expect to maintain the level of 50.9. After that, not the best indicators will come out in terms of industrial orders, which are reduced by 0.2%. Whether the US statistics will put pressure on the US dollar is quite possible, especially in anticipation of the publication of the report of the United States Department of Labor (October 4).
Further development
Analyzing the current trading chart, we see that the movement within the specified limits of accumulation (1.2270/1.2350) is still preserved, where the quotation tends to the lower border. In turn, traders continue to analyze the behavior of quotes with respect to accumulation boundaries, where some traders are already in short positions, while others consider them as a possible prospect.
It is likely to assume that the movement within the accumulation (1.2270/1.2350) will still remain on the market for some time. Whether it is worth entering the market right now, I think there is no sense, since the most attractive positions are waiting for us outside the borders. That is, if we do not have deals, then we analyze the boundaries (1.2270/1.2350) for a clear breakdown and after that we enter the market.
Based on the above information, we concretize trading recommendations:
- Buy positions are considered in the case of a clear fixation of the price above the level of 1.2350, preferably with a yield of 1.2390.
- Many traders already have positions for sale, and they are directed towards the next level of 1.2150. If we do not have positions, it makes sense to wait and enter after fixing the price below 1.2200, with the prospect of 1.2150.
As we can see, the trading recommendations remain unchanged, since the movement of quotes is still within the limits of accumulation.
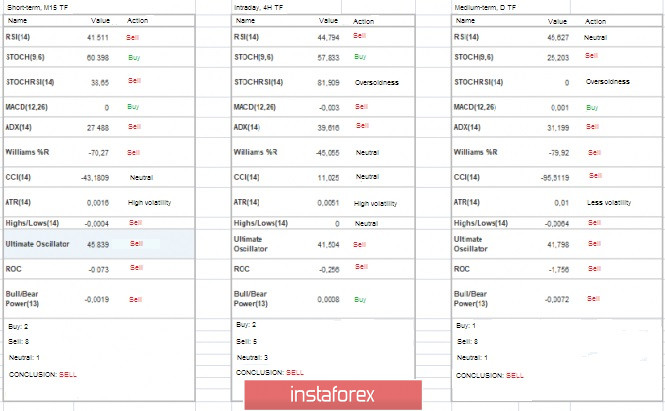
Indicator analysis
Analyzing different sector timeframes (TF), we see that the indicators in the short-term, intraday and medium-term signal a decline. When working with indicators, it is worth considering that while the price movement is within the accumulation, the indicators on short-term and intraday periods can be volatile.
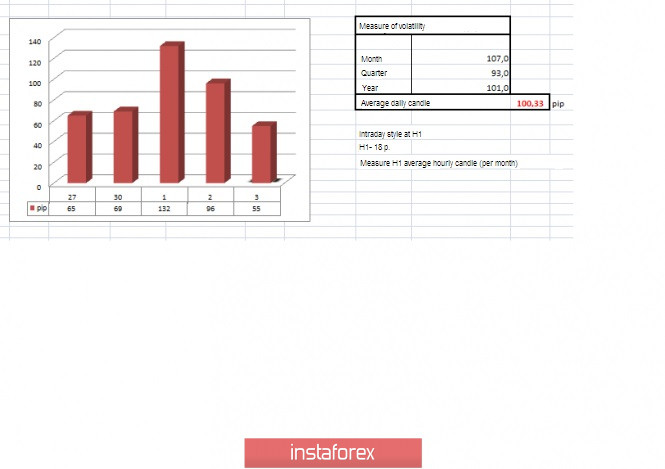
Volatility per week / Measurement of volatility: Month; Quarter; Year.
Measurement of volatility reflects the average daily fluctuation, calculated for the Month / Quarter / Year.
(October 3 was built taking into account the time of publication of the article)
The volatility of the current time is 55 points, which is a moderate indicator for this period. It is likely to suggest the preservation of the accumulation process, volatility will be locally limited relative to the built-in framework. In the case of a breakdown of accumulation, acceleration can occur, which, of course, will affect volatility.
Key level
Resistance zones: 1.2350**; 1.2500**; 1.2620; 1.2770**; 1.2880 (1.2865-1.2880)**.
Support zones: 1.2150**; 1.2000***; 1.1700; 1.1475**.
* Periodic level
** Range level
*** The article is based on the principle of conducting transactions, with daily adjustments.