From the point of view of a comprehensive technical analysis, we see that the downward movement in the structure of the flat formation of 1.2770 / 1.3000 once again encountered a range of clusters that influenced the quote during the periods of November 22 and November 12-14 . The pivot point of 1.2823 played a supporting role, dropping the quote so much that the maximum of the current week fell at the same moment. In fact, all trading volumes for short positions were absorbed by buyers, creating an impetus locally. In terms of volatility, an acceleration of 91 points was recorded, which slightly exceeds the daily average. Increased market activity is a good signal for speculators who, last week, noticed a gradual acceleration of volatility, after a twenty-day reduction. What is the reason for this particular jump, we will analyze a little later. Now, we'll turn our attention to the details. So, analyzing the hourly past day, we see that the impulse jumps were divided into two intervals, morning and evening, where the mirror level of 1.2885 played a temporary resistance point, reflecting a slight pullback in the market. Considering the summary melon, we will see these same intervals:
10: 00-12: 00 - the first upward jump;
13: 00-17: 00 - rollback from the mirror level;
18: 00-00: 00 - the second upward jump, it is the main one.
00 - rollback from the mirror level;
18: 00-00: 00 - the second upward jump, it is the main one.
00 - rollback from the mirror level; and
18: 00-00: 00 - the second upward jump, it is the main one.
As discussed in the previous review, many traders had good volumes in the hope of further decline, which did not happen, but at the same time, local jumps were waiting, and this was mentioned yesterday in the review. Thus, I do not exclude the possibility that speculators managed to snatch their piece of profit from the past rally.
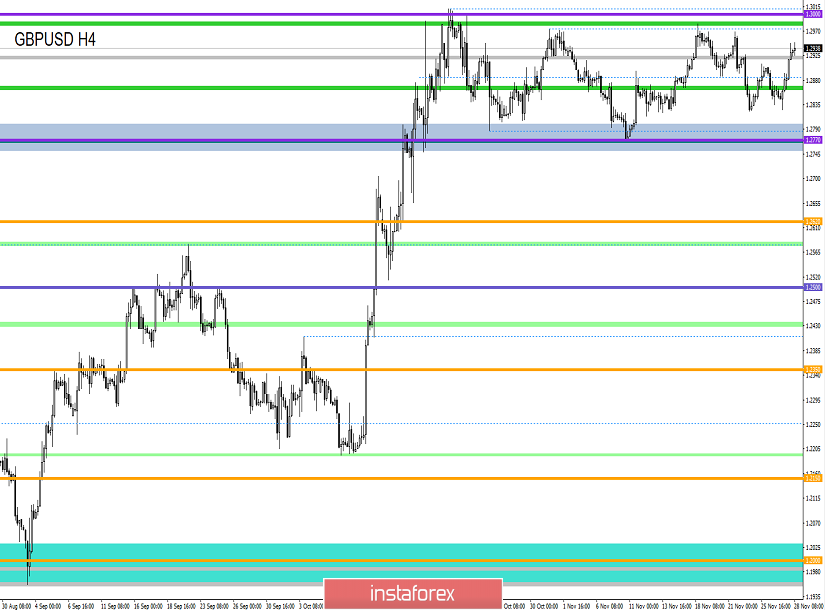
Considering the trading chart in general terms [the daily period], we see that the third cycle in the flat structure of 1.2770 / 1.3000 interrupted its construction, returning to the upper region. Whether this step is a change in trading interests and whether the upper flat border will be broken is not worth making hasty conclusions here, since the characteristic ambiguity still remains in the market, otherwise the sideways movement would have fallen.
The news background of the past day contained preliminary data on USDGDP, where economic growth slowed down from 2.3% to 2.1% with a forecast of 2.0%. In turn, data on orders for durable goods, which were supposed to decrease by 0.8%, on the contrary, grew by 0.6%, which is a good signal.
Market reaction to the statistics was practically absent, although the statistical data for the States was positive, because the pound was plunged into the information background, which was extremely wide yesterday.
To begin with, yesterday we published the sensational YouGov poll, which showed that the ruling Conservative Party is on its way to gaining a majority in the December parliamentary elections. So, according to the survey, Johnson's party can win 356 out of 650 seats in parliament, compared to 317 in the general election in 2017. While the Labor Party can win 211 seats. Against the background of such indicators and the possible victory of the conservatives, which will result in the completion of the Brexit process, the pound sterling quickly responded with local growth, which we wrote about at the beginning of the article.
The information background does not end there, Labor head Jerome Corbyn, during his press conference raised a huge stack of documents, shouting that Johnson was trying to hide the sale of our national health service [NHS]. So, this story has been going on for quite some time, at first Corbyn presented a document in which most of the text was cut out. Now he managed to get all the pages, uncensored [451 pages], where, according to the head of the Labor, it is about the redemption by the United States corporations of their national health service as soon as the Brexit transaction is completed and Johnson signs a free trade agreement with the United States.
Tori spoke almost immediately to Jerome Corbyn's cries, accusing him of lying: "We are absolutely sure that there will be no NHS sale, no privatization. The NHS will not be discussed in any way ... in any aspect. "
While everyone is discussing the election race and shouting propaganda slogans, automakers have warned that British plants will produce 1.5 million fewer cars in the next five years if the industry returns to WTO rules as a result of Brexit without a deal or at the end of the transition period.
So no matter how hard the candidates try to change the topic to the national health service, Burksit's problems still exist.
Today, in terms of the economic calendar, we do not have statistics worth paying attention to, and this is understandable since in the United States they celebrate "Thanksgiving", a day off.
Further development
Analyzing the current trading chart, we see how the quotation from the very beginning of the trading day tries to maintain the previously set inertial move, and it succeeds, but the conditional ceiling of 1.2950 / 1.3000 is already making itself felt. In fact, we may encounter local overheating of long operations and, together with the ceiling, which is already on the nose, a restoration process can occur. In terms of volatility, everything is pretty good, there is a kind of acceleration, although not yet on the scale to overcome the average value. In turn, the emotional mood of the market confirms the desire of speculators to actively participate in operations.
By detailing the per minute movement, we see that the quotation froze within the peak of 00:30 hours, forming versatile candlesticks like a Doji, which signals uncertainty and, at the same time, attempts to re-form an impulse.
In turn, speculators switched to an active fixing of previously opened buy positions, and now they are considering the recovery process with the possible opening of short positions.
Having a general picture of actions, it is possible to assume that the conditional ceiling of 1.2950 / 1.3000 will once again put pressure on the quotation and market participants, which will lead to successive downward candles on which they will be able to earn. It is worthwhile to carefully monitor the behavior of the quote, where now you can think about short positions relative to the value of 1.2920.
Based on the above information, we derive trading recommendations:
- Buy positions are considered in terms of a possible extension of an earlier inertial move, where if the price is fixed higher than 1.2950, an extension of 15-30 points is possible.
- Sales positions are considered in terms of recovery, in case the price is fixed lower than 1.2920.
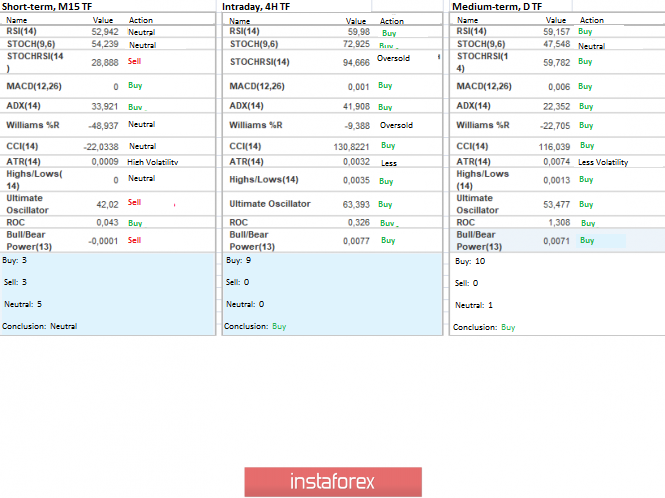
Indicator analysis
Analyzing a different sector of timeframes (TF), we see that the indicators, due to the recent surge of long positions and the transition of the average value of 1.2885 from the bottom up / up again set a bullish mood, although the movement, in general, is sideways. Minute intervals due to the stagnation and candles of the Doji type took a neutral position.
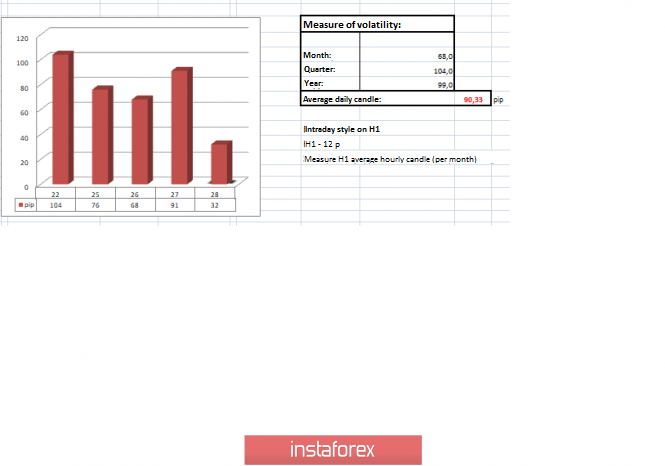
Volatility per week / Measurement of volatility: Month; Quarter Year
Measurement of volatility reflects the average daily fluctuation, calculated for the Month / Quarter / Year.
(November 28 was built taking into account the time of publication of the article)
The current time volatility is 32 points, which is closer to low indicators. It is likely to suggest that acceleration may occur during the recovery phase, but within the framework of the average.
Key levels
Resistance Zones: 1.2885 *; 1.3000; 1.3170 **; 1.3300 **.
Support areas: 1.2770 **; 1.2700 *; 1.2620; 1.2580 *; 1.2500 **; 1.2350 **; 1.2205 (+/- 10p.) *; 1.2150 **; 1,2000 ***; 1.1700; 1.1475 **.
* Periodic level
** Range Level
*** The article is built on the principle of conducting a transaction, with daily adjustment