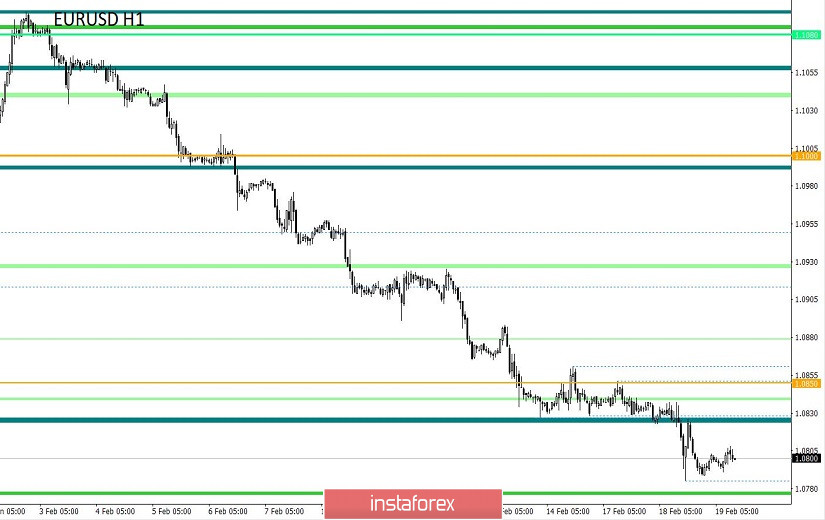
From a comprehensive analysis, we see a breakdown of the lower limit of accumulation, which led to a new surge in short positions. Now, about the details. The 60-hour stagnation in the form of an accumulation of 1.0827/1.0861 is still broken by the impulse candle in the downward direction, lowering the quote to the area of 1.0785. In fact, the overheating of short positions did not become an obstacle but only confirmed the judgment stated in the previous review regarding FOMO (lost-profit syndrome). The fracture of an oblong correction, paired with the update of the lows, led to abundant attention. And as it often happens, traders do not pay attention to the movement until the "X" moment. So it turns out that short positions are overheated. There is a continuous decline in the market for 12 days and there was no correction either.
Regarding the downward trend theory, we see further confirmation, which is expressed in updating the lows, as well as fixing the price beyond the control values. Only one thing is alarming: we consider a gradual course that has both impulses and corrections in its composition. As a result, we have a single impulse that can violate the entire concept of the theory. The danger is a fatal overheating, where stability takes a back seat, followed by another oblong correction. Now I am making an adjustment to FOMO, where perhaps common tact will still resume and the main prospects will still be achieved.
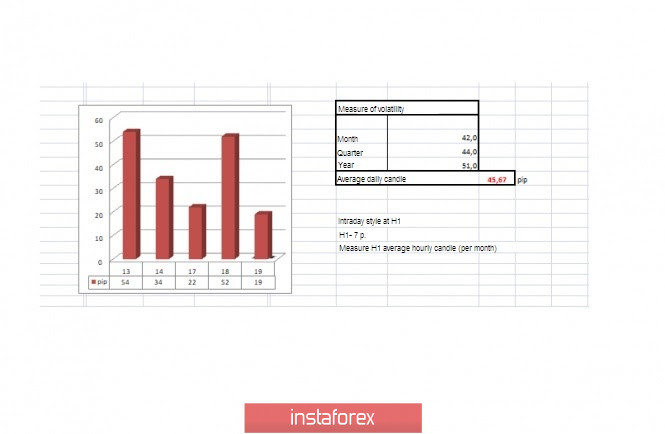
In terms of volatility, we record an acceleration after two days of slowing down, where activity has returned to the area above the daily average. In fact, we see high speculative interest due to which activity is growing. A notable point was that the day before the surge, there was a sharp drop in volatility. I advise you to remember this pattern for the future as a life hack.
Analyzing the past day by the minute, we see a characteristic zigzag-shaped oscillation, where the first impulse was in terms of a breakdown of accumulation in the downward direction. However, after that, there was a recovery and again a return.
Details: 13:45-16:00 - down; 16:15-17:45 - up; 18:00-23:30 - Down (trading terminal time).
As discussed in the previous review, medium-term traders are working on the downside, where there is already sufficient profit. At the same time, everyone else was watching the accumulation limits.
Looking at the trading chart in general terms (the daily period), we see that the quote is developing around the spring of 2017. And about 100 points left before the base of the first psychological range (1.0700/1.0850).
The news background of the last day did not contain significant statistical data on Europe and the United States, the main focus was on the speculative part.
In terms of the general information background, we see a multi-faceted noise - all of the same toxic topics that the media likes to discuss. However, let's take it in order. Brexit has been accomplished and negotiations on trade relations are just ahead. Now, in the run-up to the event, a bubble of disagreements is being inflated, where each side defends its positions.
Against this background, the Netherlands once again managed to stand out by providing statistics on how many companies moved from Britain to their country because of Brexit. So 62 organizations moved as soon as the referendum was held, after which another 78 moved, and now another 425 firms are negotiating to expand or move the company to this country. We are talking about the largest companies, thus the flow of investment is enormous.
We go further and come across a high-profile theme of coronavirus, which is replete with its scary headlines. On this topic, China temporarily removes duties on 696 products from the United States. The information is confirmed by the Chinese Ministry of Finance, which provided a list of goods from the United States on Tuesday, including soy, pork, beef, corn, wheat, medical devices, medicines, some metals, as well as crude oil and liquefied natural gas. Naturally, we should not blame the coronavirus for everything. China's actions are related to the implementation of the first phase of the trade agreement between Washington and Beijing
Today, in terms of the economic calendar, we have data on producer prices in the United States, where growth is expected from 1.3% to 1.7%. Then we get data on the construction sector, where the data is not good. The volume of construction of new homes in January fell by 30.7% (forecast), and the number of permits issued for construction has not changed.
Today ends with the publication of the minutes of the January meeting of the Federal Reserve, where we do not expect anything drastic in terms of interpretation since all the main points regarding the actions of the regulator are already known.
In turn, the head of the Federal Reserve Bank of Dallas, Robert Kaplan, said a day earlier that the committee is likely to leave the base interest rate at 1.5-1.75% until the end of 2020.
Further development
Analyzing the current trading chart, we see an insignificant pullback from the base point of 1.0789, where sellers are still eager for further declines. I do not exclude that the rollback still has the opportunity to expand the scope to the recently passed accumulation. At the same time, there is a prospect of a decline towards the lower limit of the first psychological range (1.0700/1.0850), but speculative interest is becoming unstable.
By detailing the available period every minute, we record extremely weak activity in the direction of a pullback, which is more like another stagnation.
In terms of the emotional mood of market participants, we see instability, which is expressed on the chart in the form of a variable surge. This symptom may be caused by FOMO syndrome, paired with psychological pressure from the ranges located under the quote.
In turn, medium-term traders are considering a further downward trend: 1.0700->1.0500->1.0350. Intraday traders still expect a move to the border of 1.0700, however, the risk of a rebound is high.
It is likely to assume that the downward interest will continue in the market but the overheating has already reached its limit. And at any moment, we may see a technical correction. Take this into account when calculating the risk for the transaction.
Based on the above information, we will output trading recommendations:
- Buy positions will be considered if the price is fixed higher than 1.0815, with the prospect of a move to 1.0830-1.0850, a local transaction.
- Positions for sale are already held by traders both intraday and medium-term. The first point of interaction is in the area of 1.0700.
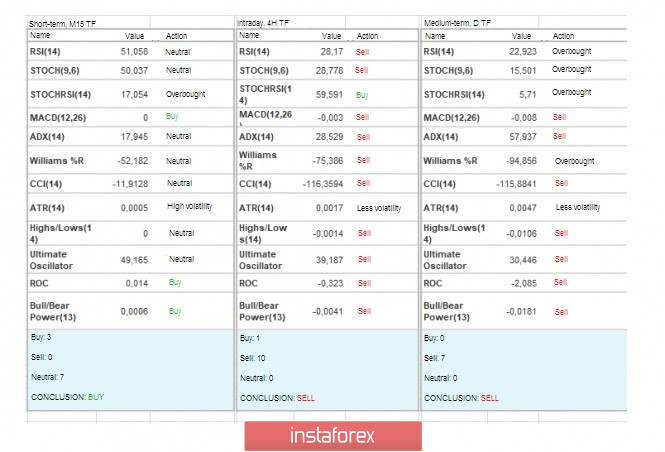
Indicator analysis
Analyzing different sectors of timeframes (TF), we see that the indicators of technical instruments are focused on the sell signal, due to the general downward background.
Volatility for the week / Volatility Measurement: Month; Quarter; Year.
The volatility measurement reflects the average daily fluctuation from the calculation for the Month / Quarter / Year.
February 19 was based on the time of publication of the article. The volatility of the current time is 19 points, which is an extremely low indicator. It is likely to assume that due to the high speculative mood, the acceleration of volatility is still possible.
Key levels
Resistance zones: 1.0850**; 1.0850**; 1.0879*; 1.0900/1.0950**; 1.1000***; 1.1080**; 1.1180; 1.1300**; 1.1450; 1.1550; 1.1650*; 1.1720**; 1.1850**; 1.2100.
Support zones: 1.0700; 1.0500***; 1.0350**; 1.0000***.
* Periodic level
** Range level
*** Psychological level
***** The article is based on the principle of conducting a transaction, with daily adjustments.