From the point of view of a comprehensive analysis, we see the refinement of the psychological level of 1.3000 with the return of the price to the mid-range area, and now, let's talk about the details. The correction move, set at the end of last week, led the quote to the area of the psychological level of 1.3000, where there was a slowdown due to regularity and, as a fact, the level was worked out in a downward direction. The set rate from the value of 1.3000 brought the quote to the mid-range area of 1.2770 // 1.2885 // 1.3000, which confirms the theory of fixing the price on a new bar.
Regarding the theory of downward development, we see that price fluctuations in the range of 1.2770 // 1.2885 // 1.3000 keep sellers with them whose weight exceeds buyers. In fact, this is a good sign for the development of the downward movement, since the clock component has already changed, and if you make a reference to a trial breakdown of the average level of 1.2885, then we have a good prospect of a decrease towards 1.2770, which would already play into the hands of the theory of trend recovery relative to medium-term upward movement In this regard, I would like to remind readers once again that the theory of top-down development is designed for the medium-term, and thus, you should not rely on lightning changes.
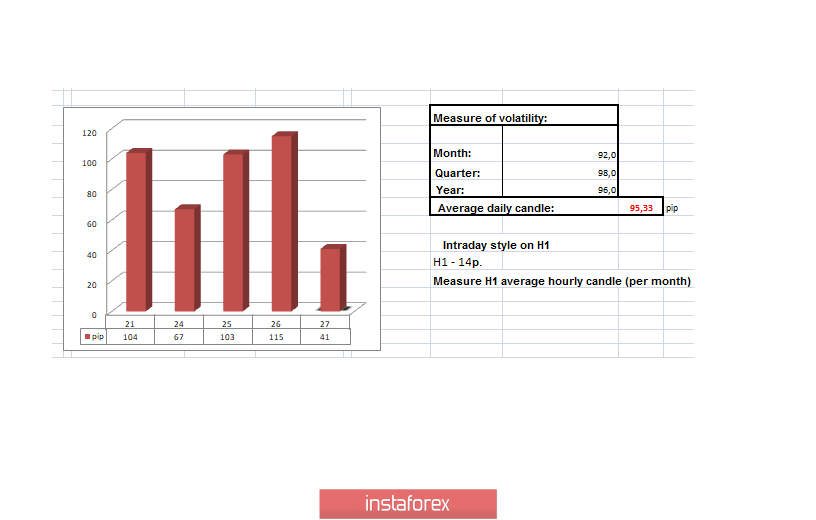
In terms of volatility, we see that the specified acceleration is still preserved to this day, where the activity of fluctuations exceeds the daily average by 21%.
Details of volatility: Friday - 104 points; Monday - 67 points; Tuesday - 103 points; Wednesday - 115 points. The average daily indicator, relative to the dynamics of volatility is 95 points [see table of volatility at the end of the article].
Detailing the day by minute, we see that the first turn of the downward movement was set at 10:45, where there was a pulsed movement until 12:00 UTC+00, and then inertial, which led us to the value of 1.2892.
As discussed in a previous review, traders viewed the 1.2975 / 1.3030 range as a temporary platform, working on a breakdown of specified boundaries. On the other hand, medium-term traders are always in a downward position, and this determination deserves respect.
The recommendation from Wednesday regarding the work on the breakdown of the set boundaries and entry into the market in case of fixing prices outside the framework made it possible to enter at the very beginning of the downward move.
[Sell positions are considered if the level of 1.3000 is worked out and the price is fixed lower than 1.2975.]
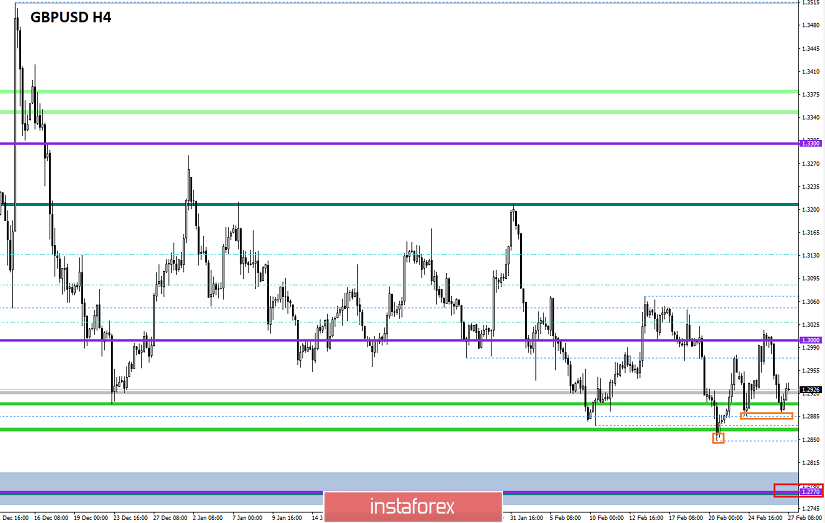
Considering the trading chart in general terms [the daily period], we see that the movement in the range 1.2770 // 1.2885 // 1.3000 is preserved, and the downward movement has a distinct structure.
Meanwhile, the news background of the past day contained data on new home sales in the United States, where growth was recorded from 708 thousand to 764 thousand with a forecast of 710 thousand.
The reaction of the market may have varied, but in general terms, the dollar strengthened against the pound sterling.
In terms of the general information background, we have news that the EU and Britain have created a joint committee that will oversee the implementation of the Brexit agreements. The EU representative on the joint committee will be the Vice President of the European Commission [EC] Maros Sefcovic, who was appointed yesterday.
"I am proud that the head of the European Commission, Ursula von der Leyen, has appointed me as the representative of the European Union and co-chair of the joint EU-Britain committee, created in accordance with the withdrawal agreement. The role of the committee should focus on overseeing compliance and application of the agreement. We will work closely with Britain to ensure that these commitments are effectively implemented. We will work closely with the main negotiator Michel Barnier and his team," said Maros Sefcovic on his video message which can be found on Twitter
In turn, Prime Minister Boris Johnson is preparing for a clash with the European Union, where a negotiating mandate from Britain will be published on Thursday [February 27]. The tension is growing, as the ambitious Johnson seeks to make the most of the moment of agreeing on conditions that will unequivocally find their criticism from the EU.
Today, in terms of the economic calendar, we have a second preliminary estimate of the United States GDP for the fourth quarter, where they expect coincidence with the first estimate, which showed an acceleration of economic growth from 2.1% to 2.3%. In fact, this is a good signal for the medium-term growth of the dollar. In accordance with the data on GDP, they will publish indicators on applications for unemployment benefits in the United States, where they expect a decrease of 9 thousand [Repeat: -11 thousand; Primary +2 thousand].
Further development
Analyzing the current trading chart, we see a characteristic pullback, which may have been associated with local overheating of short positions and the quote approaching the level of 1.2885. In fact, our theory of downward development is still relevant, only it is worth considering that the information background that is taking place can locally stir up the mood of market participants in the intraday perspective, I mean the publication of a mandate from Britain. In any case, the medium-term downward sentiment remains unchanged.
From the point of view of the emotional mood, we see that almost daily basis impulse formations arise, which indicates a high speculative interest.
By detailing the per minute portion of time, we see that a moderate upward interest lasts literally from 00:00 hours, rolling the quote towards the value of 1.2936.
In turn, intraday traders are considering further selling positions in case the price is fixed lower than 1.2885.
Having a general picture of actions, it is possible to assume that the existing pullback serves as a kind of regrouping of trading forces, where, in case of fixing a price lower than 1.2885, the way will open for us in the direction of 1.2855. A more significant prospect awaits us after passing the first value [1.2855], since the main support is in the region of 1.2770.
Based on the above information, we derive trading recommendations:
- Local positions for the purchase have already been made by traders in view of the pullback from the level of 1.2885. The subsequent move can be considered in case of an exit higher than 1.2950, towards 1.2985-1.3000.
- Sell positions are considered in case of price fixing lower than 1.2885, with the prospect of a movement to 1.2855-1.2770.
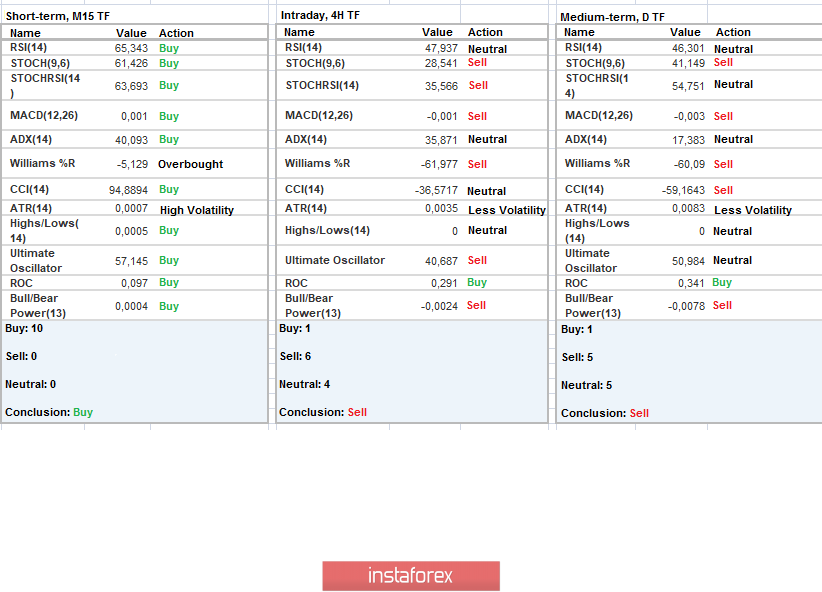
Indicator analysis
Analyzing a different sector of timeframes (TF), we see that the main periods reflect downward interest due to the return of prices to the mid-range ranges. In turn, minute intervals work on a pullback.
Volatility per week / Measurement of volatility: Month; Quarter; Year
Measurement of volatility reflects the average daily fluctuation, calculated for the Month / Quarter / Year.
(February 27 was built taking into account the time of publication of the article)
The current time volatility is 41 points, which is a moderate indicator for this time interval. It is likely to assume that volatility may have high indicators again due to the strong news and news background.
Key levels
Resistance Zones: 1.3000; 1.3170 **; 1.3300 **; 1.3600; 1.3850; 1.4000 ***; 1.4350 **.
Support Areas: 1.2885 *; 1.2770 **; 1.2700 *; 1.2620; 1.2580 *; 1.2500 **; 1.2350 **; 1.2205 (+/- 10p.) *; 1.2150 **; 1,2000 ***; 1.1700; 1.1475 **.
* Periodic level
** Range Level
*** Psychological level
**** The article is built on the principle of conducting a transaction, with daily adjustment