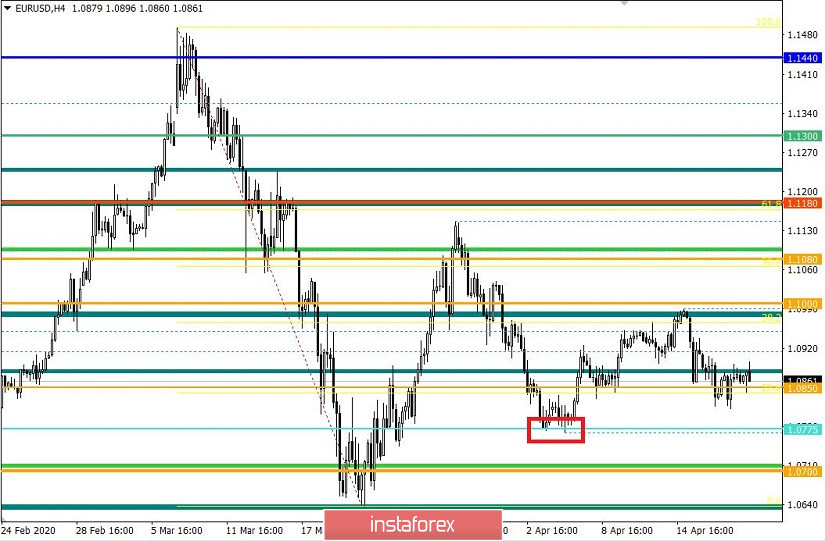
Using integrated analysis, we see a significant recovery process relative to the previous cycle. The last trading week brought the quote to the area of the psychological level of 1.1000, where the upward movement was completed, and a new one replaced it. So, the previous cycle has worked out the downward development by 80%, which means that the compression structure is still relevant and we may soon see a more significant acceleration.
Regarding development, the successive fluctuations reveal that amplitude compression took place on the market, and the next critical currents will be in the values of 1.1000 [UP] and 1.0768 [DOWN]. No one excludes the possibility that the compression will continue, so, to form the next lever, we should work out about 50-60% of the previous cycle. With the existing rollback, almost 50% is done already.
Meanwhile, Friday's volatility did not just record another slowdown, but normalized the average daily indicator, where there is already a value below 100 points. As we have discussed about two weeks ago, this is a good signal for the market to adapt to the external background. The panic mood still persists, but it also normalizes over time.
Details of volatility: Monday - 155 points; Tuesday - 183 points; Wednesday - 115 points; Thursday - 278 points; Friday - 166 points; Monday - 151 points; Tuesday - 234 points; Wednesday - 243 points; Thursday - 326 points; Friday - 194 points; Monday - 191 points; Tuesday - 160 points; Wednesday - 133 points; Thursday - 188 points; Friday - 194 points; Monday - 134 points; Tuesday - 127 points; Wednesday - 136 points; Thursday - 147 points; Friday - 91 points; Monday - 67 points; Tuesday - 142 points; Wednesday - 72 points; Thursday - 110 points; Friday - 33 points; Monday - 74 points; Tuesday - 84 points; Wednesday - 134 points; Thursday - 95 points; Friday - 80 pips The average daily indicator, relative to the dynamics of volatility is 95 points [see table of volatility at the end of the article].
As discussed in the previous review , we planned to decrease the pair to the level of 1.0775. However, to successfully execute it, the quote had to be fixed lower than 1.0815, which did not happen in the H1 and H4 periods. As a result, alternative positions were won back 100%.
[Open buy positions above 1.0840, with goals to 1.0860-1.0875]
Looking at the daily chart, you will see the same theory of successive amplitudes that reflect compression.
Last Friday, the final data regarding inflation in the Eurozone came out. It coincided with the preliminary estimate, so we saw a decline from 1.2% to 0.7%. This is a very negative factor. Moreover, under the existing conditions and fears of a decline in inflation, it may push the regulator [ECB] to lower the refinancing rate.
In terms of general information background, there are active discussions about lifting the quarantine measures around the world. One of the first to take real steps was Germany, who is planning to reopen small stores on April 20. Meanwhile, the Western press is actively discussing the gradual lifting of restrictions, featuring Trump's plan called "Opening Up America Again."
Trump's plan has three phases:
First is retaining the 6-pound distance rule, where churches, parks, and movie theaters can be opened if distance is observed. Any trips, schools, kindergartens and meetings in groups of more than 10 people, on the other hand, is prohibited.
The second phase provides permission for groups of no more than 50 people, and allows schools and kindergartens to open.
The third phase allows pensioners to resume social activity, but they must maintain social distance. At the same time, large facilities can resume work, but according to limited protocols.
In terms of economic calendar, data on the trade balance of the eurozone, which recorded a surplus of 23.0 billion euros, against the forecast of 17.5 billion euros, was published today. For the US, there are no statistics published, so special attention will be paid to the epidemiological situation, as well as the external background.
Further development
Analyzing the current trading chart, we see that the local upward trend returned the quote to the area of 1.0895. Regarding compression, the subsequent cycle reached 50% of the output, where, if it is enough, the new move will return the quote to the area of 1.0850.
Analyzing the minute period, we see that the reversal of long positions happened at the start of the European session.
Thus, we can assume that the reversal of the price to the area of 1.0850 will happen soon, however, it is not the main goal, since on Friday, we aimed at the level of 1.0775. Its break will represent a partial destruction of the compression model.
Based on the information above, we formulated these trading recommendations:
- Open sell positions with the first target to 1.0850. After that, wait for the price to fix below 1.0840 and continue on to 1.0820. The last step is targeting 1.0775, after the price fixes below 1.0815.
- Open buy positions if the price fixes above 1.0900, with a local goal to 1.0940.
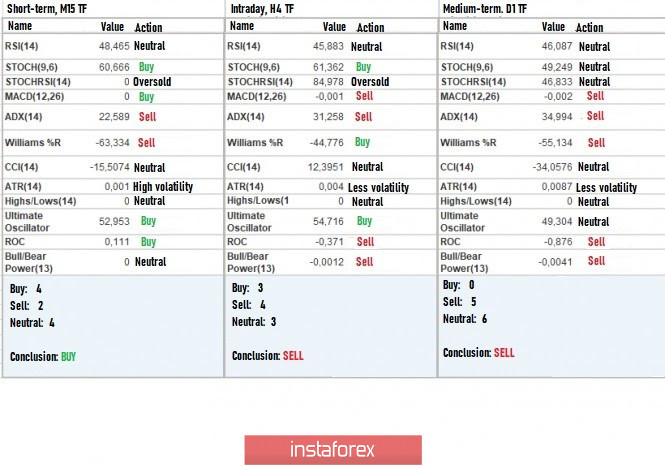
Indicator analysis
Analyzing the different sector of timeframes (TF), we see that the indicators relative to hourly and daily periods are focused on the downward cycle. Meanwhile, the minute periods are working on the current movement.
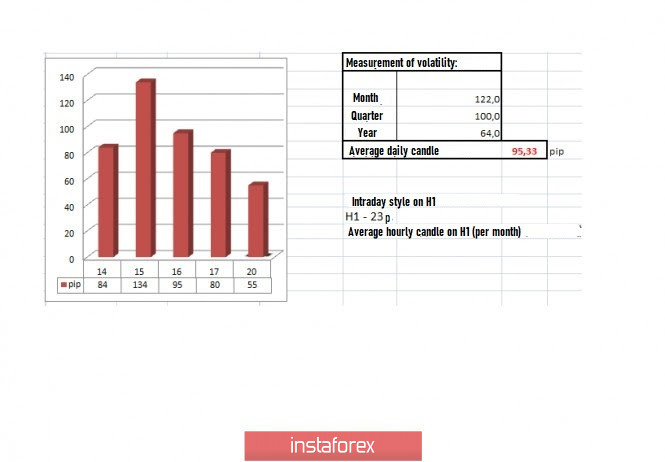
Volatility per week / Measurement of volatility: Month; Quarter; Year
The volatility measurement reflects the average daily fluctuation calculated by Month / Quarter / Year.
(April 20 was built by taking into account the time of publication of the article)
The current volatility is 55 points, which is 42% lower than the daily average. Because of this, we can assume that even if the steps are just partially met, we will get a good increase in activity. The main goal, however, is still completing the compression model.
Key levels
Resistance zones: 1.0850 **; 1,1000 ***; 1.1080 **; 1,1180; 1.1300; 1.1440; 1.1550; 1.1650 *; 1.1720 **; 1.1850 **; 1,2100
Support Areas: 1.0775 *; 1.0650 (1.0636); 1,0500 ***; 1.0350 **; 1,0000 ***.
* Periodic level
** Range Level
*** Psychological level