EUR/USD on 5M chart
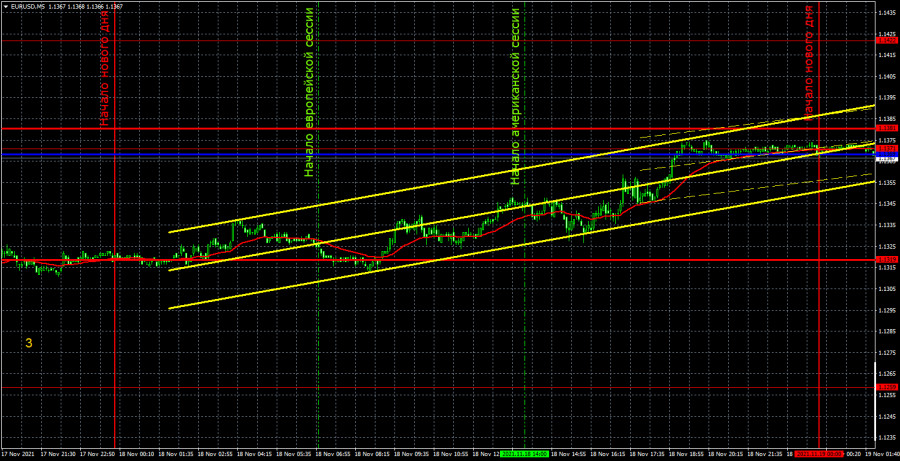
On Thursday, EUR/USD continued to trade in a sideways manner. The pair passed only 40-50 pips within the day which is considered low volatility. Therefore, traders could not expect a large number of trading signals. Moreover, not a single important report or a fundamental event took place within the day. Thus, the market had no triggers to react to. This made Thursday the most unfavorable day for trading the EUR/USD pair. Still, there was a minimum upward bias, but it was of no help to traders. Now let's take a look at the illustration above and analyze the trading signals. In fact, there is nothing to analyze since not a single signal was generated during the day. Only in the morning, the price tested the support level of 1.1319. However, signals are not usually formed near the support levels, only around the extremum levels. The pair was moving towards the critical Kijun-sen line throughout the day but failed to test it by the end of the session. Besides, we do not consider signals that were formed in the evening or at night. Thus, neither profit nor loss was received on Thursday.
EUR/USD on 1H chart
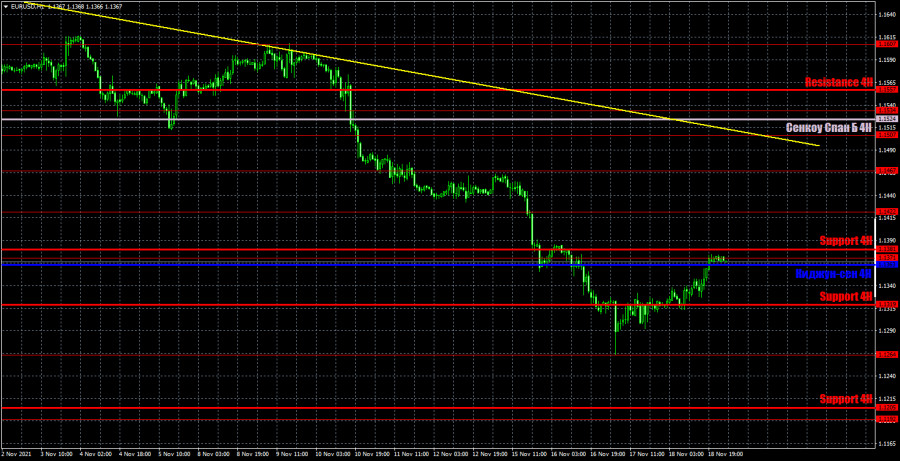
On the hourly time frame, the downtrend still persists as the descending trendline remains relevant. In the past few days, the pair has been going through a correction, but it has not been able to overcome even the Kijun-sen line. Therefore, the correction is very weak, and the bulls seem unwilling to step in and buy the European currency. On Friday, we would like to highlight the following levels for trading: 1.1264, 1.1371, 1.1422, as well as the Senkou Span B (1.1524) and Kijun-sen (1.1363) lines. The Ichimoku indicator lines can change their position during the day, which should be taken into account when looking for trading signals. Signals can come in the form of bounces and breakouts from these levels and lines. Do not forget about placing a Stop Loss order at a breakeven point as soon as the price moves by 15 pips in the right direction. This will protect your trades against possible losses if the signal turns out to be false. On November 19, the only thing that traders can pay attention to during the day is the statements of the ECB President, Christine Lagarde. Two speeches are expected today. So, in just five working days the ECB head will have delivered six statements. Given that she did not say anything new or important on Monday, Tuesday, or Wednesday, we do not expect any market reaction to this event on Friday either. Moreover, the second speech is scheduled for Friday evening when all trades should be closed. Most likely, her rhetoric will remain dovish and won't surprise traders.
Analysis of COT report
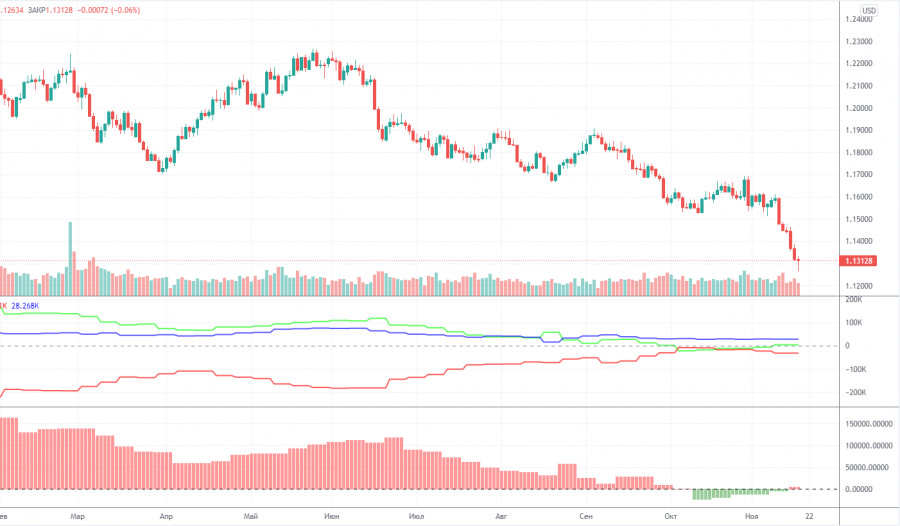
During the last reporting week (November 2-8), the sentiment of the non-commercial group of traders has changed. The non-commercial category of traders closed 11,000 sell contracts and 15,000 buy contracts during the week. Thus, the net position of professional traders increased by 10,000 which is an average value. It should be noted that the changes in the sentiment of major players have been minimal lately. Nevertheless, the tendency is clear now: non-commercial traders are increasing sell orders, and commercial ones - buy orders. Let me remind you that it is the non-commercial players that determine the market sentiment and possible direction of a particular currency. Therefore, since major market players have been getting more and more bearish on the pair for more than six months, the euro is highly likely to continue its fall. Importantly, the COT reports now reflect more or less what is happening in the market, which makes it possible to assume further changes in the value of the euro. Currently, the number of long positions opened by the non-commercial group of traders is still bigger than the number of short positions. Thus, the net position is positive and the mood is characterized as formally bullish. Notably, in the last few weeks, the green line of the indicator 1has been rising (net position of non-commercial traders). If the downtrend persisted, this line would continue to decline. Therefore, a further fall in the euro is still not obvious, but very likely.
On the chart
Support and resistance levels are the levels that serve as targets when buying or selling the pair. You can place Take Profit near these levels.
The Kijun-sen and Senkou Span B lines are the Ichimoku indicator lines transferred to the 1-hour time frame from the 4-hour time frame.
Support and resistance areas are areas from which the price has repeatedly bounced off.
Yellow lines are trend lines, trend channels and any other technical patterns.
Indicator 1 on the COT chart reflects the size of the net position of each category of traders.
Indicator 2 on the COT chart reflects the size of the net position for the mon-commercial category of traders.


