To open long positions on EUR/USD:
In the morning review, I paid attention to the level of 1.1363 and recommended it as a point for entering the market. Let's take a look at the 5-minute chart and see what happened there. After strong growth yesterday, the euro bulls failed to maintain the uptrend. The macroeconomic data for the euro area did not affect the volatility of the pair in any way. In the near term, markets will most likely focus on the CPI data in the US. A false breakout at 1.1363 in the first half of the day and a return to this level generated a buy signal. However, having gained 13 pips, the pair suddenly lost its bullish momentum. No other entry points were formed, so I had to revise the technical picture of the pair.
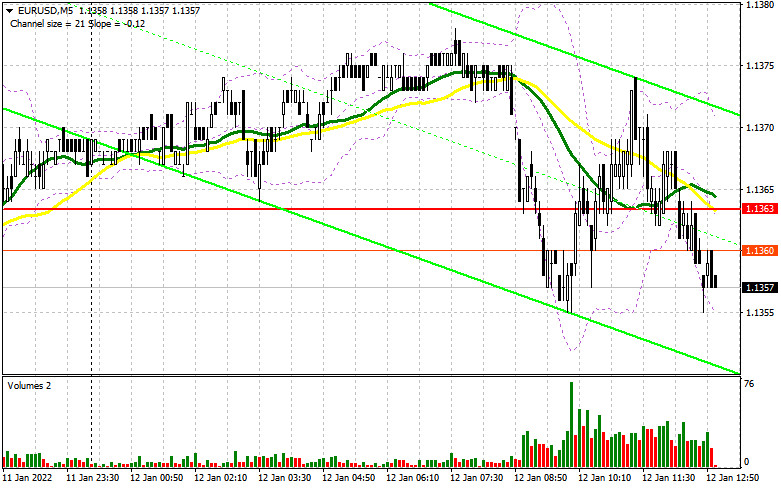
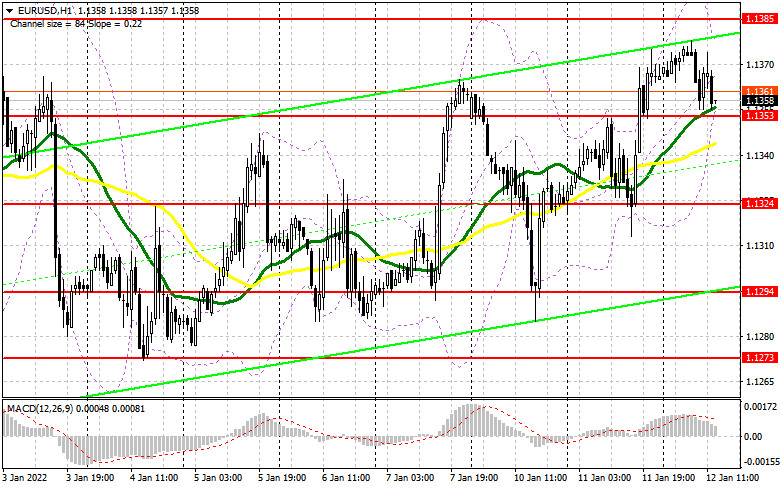
As I mentioned earlier, a lot will depend on the US inflation data for December which will be released shortly. If consumer prices stay near the current levels, the EUR/USD pair is set to grow in the short term. But before the pair can leave the sideways channel and break through its upper boundary, buyers need to focus on the level of 1.1353. This level was formed by end of the morning session. Moving averages that support the bullish trend are located slightly below this area. A false breakout at this level and weak data in the US should prompt the euro to retest the high of 1.1385. It is important for bulls to break through this range, and a retest of this level will pave the way towards the levels of 1.1415 and 1.1442 where I recommend taking profit. A further target will be the area of 1.1480. If the price reaches this level, it will confirm the resumption of the bullish trend. In case the pair declines during the North American session and bulls lose momentum at 1.1353, it is better to wait until the quote reaches stronger support at 1.1324. I recommend opening long positions there only after a false breakout is formed. You can buy EUR/USD immediately on a rebound from the level of 1.1294, setting the next target within a daily correction of 20-25 pips.
To open short positions on EUR/USD:
Sellers have made several attempts to change the situation but with no success so far. The market seems to be waiting for a new driver, the US report on inflation. If the actual data exceeds the forecast, it will give a strong bullish signal for the US dollar and cause a decline in the EUR/USD pair. However, if the pair rises in the course of the New York session, bears will need to do their best to protect the resistance at 1.1385, which is the upper boundary of a wide sideways channel formed at the beginning of this year. A movement above this level will change the direction of the pair and push it out of the flat channel. A false breakout at 1.1385 will create the first entry point for going short, considering the resumption of downward pressure and a decline towards the 1.1353 area. Both bulls and bears will fight for this level since it is of key importance to them. Moreover, moving averages that support the bullish trend are located below this level. A breakout of this range and its test from bottom to top will give an additional signal to open short positions with the prospect of falling to a low of 1.1324. Only if the price leaves this range, the market direction may reverse to the downside, thus canceling a number of stop-loss orders set by the buyers. This will send EUR/USD to the lows of 1.1294 and 1.1273 where I recommend taking profit. In case the euro develops an uptrend and the bears' activity drops at 1.1385, it is better to wait with selling the pair. The best scenario here will be to open short positions on a false breakout at 1.1415. It is possible to sell EUR/USD right after a rebound from the high of 1.1442, or even higher, near the level of 1.1480, considering a downward correction of 15-20 pips as the next target.
The COT report (Commitment of Traders) for January 4 revealed a sharp increase in the number of long positions and a reduction in short ones, which led to a change in the negative delta value. This suggests that the market sentiment is gradually changing. The demand for the European currency remains high despite the expected changes in the policy of the US Federal Reserve. This week we are waiting for a report on US inflation which is expected to rise above 7% on a yearly basis. If this forecast is confirmed, the US central bank may accelerate the pace of a rate hike. Considering that the situation in the US labor market has improved, we can expect at least four interest rate hikes this year. Meanwhile, the European Central Bank plans to end its emergency bond purchase program in March this year. Apart from this, nothing else has been done by the regulator to tighten its monetary policy which limits the upward potential of risk assets. The COT report indicated that long positions of the non-commercial group of traders went up from 196,595 to 199,073, while short positions fell from 206,757 to 200,627. This suggests that traders will continue to add more long positions on the euro, hoping for an extended uptrend. At the end of the week, the total non-commercial net position decreased its negative value from -10,162 to -1554. The weekly closing price rose slightly and amounted to 1.1302 against 1.1277 a week earlier.

Indicator signals:
Moving averages
The pair is currently trading just above the 30- and 50-day moving averages, which indicates the advantage of the euro buyers.
Please note that the author analyzes the time period and prices of moving averages for the H1 chart only which differs from the general definition of the classic daily moving averages on the D1 chart.
Bollinger Bands
In case of growth, the upper band of the indicator at 1.1375 will act as resistance. A breakout of the lower band in the area of 1.1353 will deepen the fall of the pair.
Description of indicators
• A moving average determines the current trend by smoothing volatility and noise. 50-day period; marked in yellow on the chart;
• A moving average determines the current trend by smoothing volatility and noise. 30-day period; marked in green on the chart;
• Indicator MACD (Moving Average Convergence/Divergence) Fast EMA, 12-day period; Slow EMA, 26-day period. SMA with a 9-day period;
• Bollinger Bands: 20-day period;
• Non-commercial traders are speculators such as individual traders, hedge funds, and large institutions who use the futures market for speculative purposes and meet certain requirements;
• Long non-commercial positions represent the total number of long open position of non-commercial traders;
• Short non-commercial positions represent the total number of short open position of non-commercial traders;
• The total non-commercial net position is the difference between short and long positions of non-commercial traders.


