empty
08.02.2022 07:29 PM
EUR/USD analysis on February 8. The market froze, there is no news

This image is no longer relevant

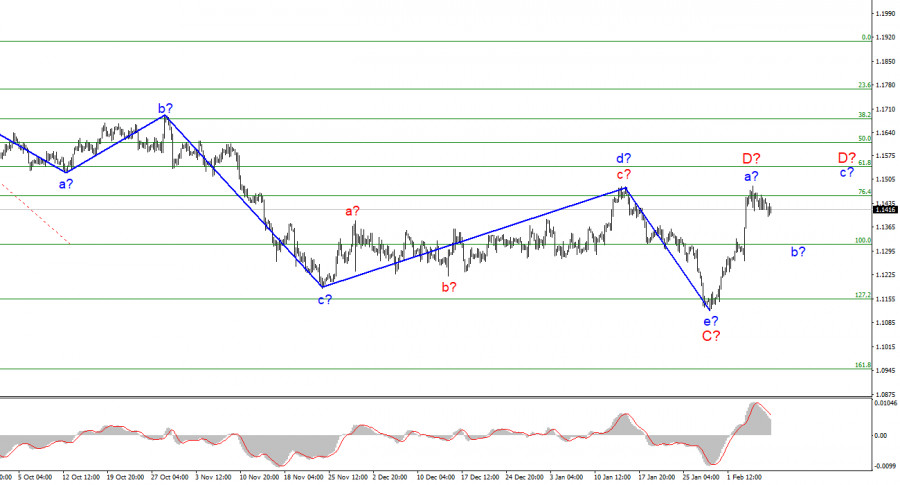
The wave marking of the 4-hour chart for the euro/dollar instrument has undergone certain changes, but nothing drastic. In the last week, a fairly strong increase in quotes continued. Thus, wave e-C is recognized as completed, since it turned out to be about the same size as the previous wave d-C. Therefore, the current upward wave is either D or 1. In the first case, the increase in the euro currency may already be completed. The picture below clearly shows that the correction wave B turned out to be shortened. The same can happen with wave D. An unsuccessful attempt to break through the 1.1455 mark, which corresponds to 76.4% Fibonacci, may become the second in recent weeks and lead to a departure of quotes from the reached highs, as well as to the end of the current wave. Thus, the wave marking now indicates a decline in quotes. And depending on how strong this decline will be, it will be possible to talk about which wave is being built now. The proposed wave D may turn out to be three-wave, but for now, this option looks like a backup.

The market can only wait for the US inflation report

The euro/dollar instrument fell by 30 basis points on Tuesday. Market activity remains very weak. The instrument continues its unhurried departure from the previously reached highs. Since the news background is now almost completely absent, the weak activity of the market does not raise any questions. In this case, if the market does not find reasons to trade more actively, it remains only to rely on those economic events that will take place this week. And the list here, I must say, is small. On Thursday, the US will release an inflation report for January. And perhaps that's all. I don't take into account those reports that the market reacts to once a year. But what can we expect from the inflation report? Forecasts suggest that this indicator will continue to grow and will amount to 7.3% y/y by the end of January. How will this affect the demand for the dollar? I believe that the only thing that can be expected with such a value of the indicator is a new increase in the US currency. There are two reasons for this. First, the wave markup now implies an increase in the dollar. Second, rising inflation will mean that the Fed will have to act even faster and even more aggressively in changing the parameters of monetary policy. The more inflation rises, the more difficult and longer it will be to bring it back to 2%, which is the "target" for the Fed. Therefore, I expect a slight decline in the instrument until Thursday, and on Thursday it may intensify. What will happen next largely depends on a successful or unsuccessful attempt to break through the 1.1314 mark, which corresponds to 100.0% Fibonacci.

General conclusions

Based on the analysis, I conclude that the construction of the ascending wave C is completed. However, wave D may already be completed too. If so, now is a good time to sell the European currency. At least with a target located near the 1.1314 mark. Another upward wave can be built inside wave D. And if the current wave is recognized not as D, but as 1 as part of a new upward trend segment, then a new upward wave is guaranteed to go beyond the peak of February 4. Thus, now cautious sales are ready for new purchases.

This image is no longer relevant

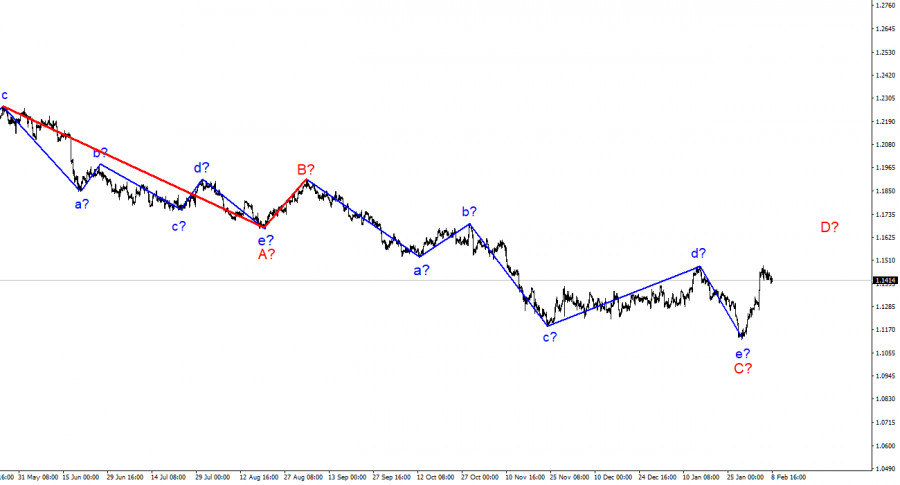
On a larger scale, it can be seen that the construction of the proposed wave D has now begun. This wave can be shortened or three-wave. Considering that all the previous waves were not too large and were approximately the same size, the same can be expected from the current wave. There are reasons to assume that wave D has already been completed, but a further increase in quotes will force us to reconsider this assumption.

Chin Zhao,
Chuyên gia phân tích của InstaForex
© 2007-2025
Summary
Urgency
Analytic
Alexander Dneprovskiy
Start trade
Kiếm lợi nhuận từ những biến đổi giá của tiền điện tử với InstaForex.
Tải MetaTrader 4 và mở giao dịch đầu tiên của bạn.
  • Grand Choice
    Contest by
    InstaForex
    InstaForex always strives to help you
    fulfill your biggest dreams.
    THAM GIA CUỘC THI

Các bài báo được đề xuất

Phân tích GBP/USD ngày 28 tháng 7, 2025

Mô hình sóng cho GBP/USD tiếp tục chỉ ra sự hình thành của cấu trúc sóng xung lực tăng giá. Mô hình sóng gần như giống hệt với EUR/USD

Chin Zhao 21:13 2025-07-28 UTC+2

Phân tích EUR/USD vào ngày 28 tháng 7 năm 2025

Mẫu hình sóng trên biểu đồ 4 giờ của cặp EUR/USD đã không thay đổi trong vài tháng qua. Đoạn xu hướng tăng vẫn đang phát triển, trong

Chin Zhao 21:06 2025-07-28 UTC+2

Dự Báo Hàng Tuần Dựa Trên Phân Tích Sóng Đơn Giản cho GBP/USD, AUD/USD, USD/CHF, EUR/JPY, AUD/JPY, và Chỉ Số USD — Ngày 28 Tháng 7

Đồng bảng Anh dự kiến sẽ tiếp tục giảm trong tuần tới, nằm trong vùng hỗ trợ được dự đoán. Trong vài ngày đầu, khả năng

Isabel Clark 08:25 2025-07-28 UTC+2

Dự Báo Hàng Tuần Dựa Trên Phân Tích Sóng Đơn Giản cho EUR/USD, USD/JPY, GBP/JPY, USD/CAD, NZD/USD, VÀNG tính đến ngày 28 tháng 7

Trong tuần tới, đồng euro dự kiến sẽ tiếp tục di chuyển trong một phạm vi xác định giữa các vùng gần nhất. Ban đầu, tỷ giá hối đoái

Isabel Clark 00:48 2025-07-28 UTC+2

Phân tích GBP/USD vào ngày 24 tháng 7 năm 2025

Mẫu hình sóng của cặp GBP/USD tiếp tục chỉ ra sự hình thành của sóng đẩy đi lên. Bức tranh sóng gần như giống hệt với EUR/USD, do đồng

Chin Zhao 20:17 2025-07-24 UTC+2

Phân Tích EUR/USD Ngày 24 Tháng 7, 2025

Cặp tiền tệ EUR/USD ghi nhận một sự giảm nhẹ vào thứ Năm, với thị trường dành phần lớn thời gian trong ngày ở trạng thái hoạt động thấp

Chin Zhao 20:00 2025-07-24 UTC+2

Phân Tích GBP/USD Vào Ngày 23 Tháng 7, 2025

Mô hình sóng cho GBP/USD tiếp tục chỉ ra sự hình thành của cấu trúc sóng tăng. Bức tranh sóng gần giống với EUR/USD, bởi đồng

Chin Zhao 20:25 2025-07-23 UTC+2

Phân tích EUR/USD ngày 23 tháng 7, 2025

Mẫu hình sóng đối với GBP/USD tiếp tục chỉ ra sự hình thành của cấu trúc sóng đẩy tăng giá. Bức tranh sóng gần như tương tự với EUR/USD

Chin Zhao 20:17 2025-07-23 UTC+2

Phân tích GBP/USD vào ngày 22 tháng 7, 2025

Mẫu sóng của GBP/USD tiếp tục cho thấy sự hình thành của cấu trúc sóng đẩy lên. Cấu hình sóng gần như giống hệt với EUR/USD, vì đồng

Chin Zhao 20:26 2025-07-22 UTC+2

Phân Tích EUR/USD Ngày 22 Tháng 7, 2025

Mô hình sóng trên biểu đồ 4 giờ của cặp tiền tệ EUR/USD vẫn giữ nguyên không đổi trong nhiều tháng liên tiếp. Sự hình thành của một đoạn

Chin Zhao 20:23 2025-07-22 UTC+2
Không thể nói chuyện ngay bây giờ?
Đặt câu hỏi của bạn trong phần trò chuyện.
Widget callback
 

Dear visitor,

Your IP address shows that you are currently located in the USA. If you are a resident of the United States, you are prohibited from using the services of InstaFintech Group including online trading, online transfers, deposit/withdrawal of funds, etc.

If you think you are seeing this message by mistake and your location is not the US, kindly proceed to the website. Otherwise, you must leave the website in order to comply with government restrictions.

Why does your IP address show your location as the USA?

  • - you are using a VPN provided by a hosting company based in the United States;
  • - your IP does not have proper WHOIS records;
  • - an error occurred in the WHOIS geolocation database.

Please confirm whether you are a US resident or not by clicking the relevant button below. If you choose the wrong option, being a US resident, you will not be able to open an account with InstaForex anyway.

We are sorry for any inconvenience caused by this message.