empty
 
 
15.12.2022 10:24 AM
EURUSD and GBPUSD trading plan and analysis for beginners on December 15, 2022

Economic calendar for December 14

UK inflation data revealed that consumer prices slowed down to 10.7% from 11.1% while the forecast predicted a decline to 10.9%. Despite some positive dynamics, inflation is still running high.

The reaction of the pound sterling market was rather neutral.

The key market-moving event of the past day and the whole month was the Fed's policy meeting.

As was widely expected, the Fed raised the funds rate by 50 basis points. This is actually the first step to slow down the pace of tightening since the rate-hiking cycle started. In theory, this factor should have acted as a driver for financial markets. Yet, the reaction was different.

Why were market participants disappointed?

First of all, speculations suggesting that the Fed was going to ease the pace of rate hikes have been going on since autumn.

Secondly, the regulator has revised its outlook for further rate hikes.

By the end of 2023, the key rate may reach the level of 5.1%, while the previous forecast was 4.6%.

Besides, the average rate target level has been revised for 2024 and 2025.

So, as we can see, the market was disappointed by the FOMC December meeting. The US stock market has entered the red zone.

Current losses:

- NASDAQ 100 -2.5%

- S&P500 -2.0%

- BTC/USD -2.5%

This image is no longer relevant

Analyzing charts for December 14

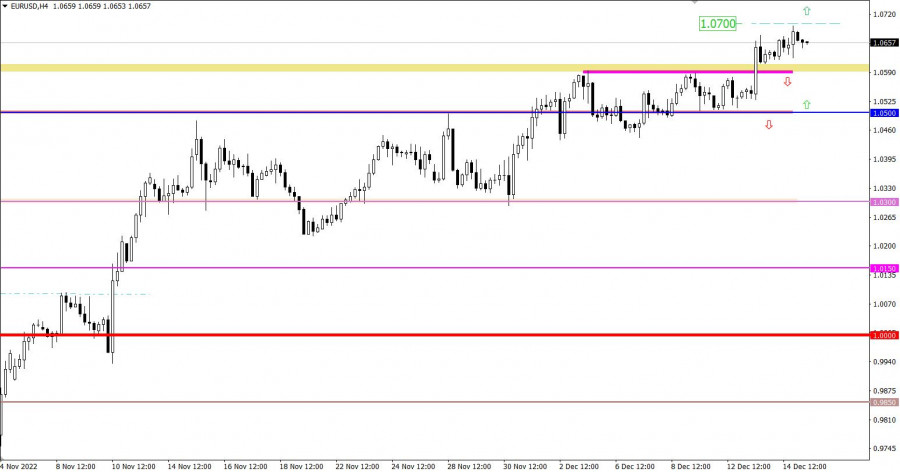
The euro closely approached the level of 1.0700 against the US dollar and then performed a slight pullback. In fact, bulls kept adding more long positions, thus extending the ongoing upward movement.

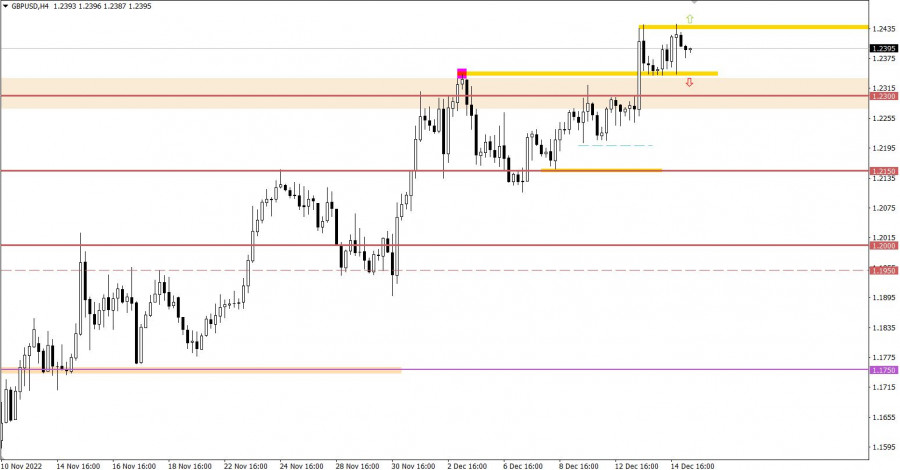
Yesterday, GBP/USD was trading high within an uptrend allowing traders to open more long positions. There are currently no signs of a trend reversal. The price was simply holding within the existing upward cycle.

Economic calendar for December 15

Today, traders will take notice of two central banks' meetings, the ECB and the Bank of England. According to forecasts, the regulator is expected to raise the rate by 50 basis points.

The market will especially focus on the ECB meeting results and the press conference that will follow it. Investors will be looking for clues regarding the possible easing of the ECB monetary policy.

In case the EU regulator gives such a hint, the market will react accordingly.

Timing

Bank of England interest rate decision – 12:00 GMT

ECB interest rate decision – 13:15 GMT

ECB press conference – 13:45 GMT

EUR/USD trading plan on December 15

As for the euro/dollar pair, a lot will depend on the ECB decision as it will be a driving force for traders. From the technical viewpoint, a steady hold above the level of 1.0700 will pave the way for the bulls to higher targets. On the other hand, a return of the price below 1.0600 may initiate a correction in the euro.

This image is no longer relevant

GBP/USD trading plan on December 15

At the moment, an ongoing flat movement near the current highs may indicate the accumulation of trading volumes. The boundaries of the flat channel found between 1.2340 and 1.2450 will serve as the main targets. The best strategy here is to wait until the price breaks through either of the boundaries.

Summing up:

An upward scenario will be relevant if the price holds above the level of 1.2450 on the 4-hour chart. This move will reinforce the bullish bias, enabling the buyers to move higher.

A downward scenario will be activated if the price settles below 1.2340 on the 4-hour chart. In this case, the price may fall to at least 1.2300 with a prospect of a further decline.

This image is no longer relevant

What's on the charts

The candlestick chart type is white and black graphic rectangles with lines above and below. With a detailed analysis of each individual candle, you can see its characteristics relative to a particular time frame: opening price, closing price, intraday high and low.

Horizontal levels are price coordinates, relative to which a price may stop or reverse its trajectory. In the market, these levels are called support and resistance.

Circles and rectangles are highlighted examples where the price reversed in history. This color highlighting indicates horizontal lines that may put pressure on the asset's price in the future.

The up/down arrows are landmarks of the possible price direction in the future.

Gven Podolsky,
Chuyên gia phân tích của InstaForex
© 2007-2024
Kiếm lợi nhuận từ những biến đổi giá của tiền điện tử với InstaForex.
Tải MetaTrader 4 và mở giao dịch đầu tiên của bạn.
  • Grand Choice
    Contest by
    InstaForex
    InstaForex always strives to help you
    fulfill your biggest dreams.
    THAM GIA CUỘC THI
  • Tiền gửi lần truy cập
    Ký quỹ tài khoản của bạn với $3000 và nhận được $5000 nhiều hơn!
    Trong Tháng 11 chúng tôi xổ $5000 trong chiến dịch Chancy Deposit!
    Có được một cơ hội giành chiến thắng bằng việc ký quỹ $3000 vào một tài khoản giao dịch. Đáp ứng được điều kiện này, bạn trở thành một người tham gia chiến dịch.
    THAM GIA CUỘC THI
  • Giao dịch khôn ngoan, thành công
    Nạp tiền vào tài khoản của bạn với ít nhất $ 500, đăng ký cuộc thi và có cơ hội giành được các thiết bị di động.
    THAM GIA CUỘC THI
  • 100% tiền thưởng
    Cơ hội duy nhất của bạn để nhận 100% tiền thưởng khi gửi tiền
    NHẬN THƯỞNG
  • 55% Tiền thưởng
    Đăng ký tiền thưởng 55% cho mỗi lần gửi tiền của bạn
    NHẬN THƯỞNG
  • 30% tiền thưởng
    Nhận 30% tiền thưởng mỗi khi bạn nạp tiền vào tài khoản của mình
    NHẬN THƯỞNG

Các bài báo được đề xuất

Không thể nói chuyện ngay bây giờ?
Đặt câu hỏi của bạn trong phần trò chuyện.
Widget callback