empty
12.01.2023 07:39 AM
Outlook and trading signals for EUR/USD on January 12. COT report. Analysis of market situation. All eyes on the US inflation report!

M5 chart of EUR/USD

This image is no longer relevant

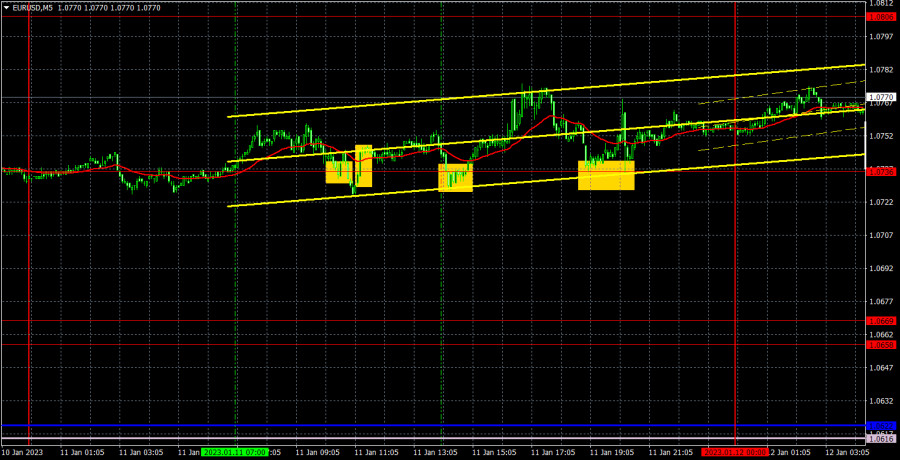
On Wednesday, EUR/USD continued to move mainly sideways. There was a slight upward bias, but the pair constantly rolled back down, constantly changing the direction of the movement. The US and the EU did not release any reports so traders had nothing to react to, but they still find reasons to buy the euro, though it is very difficult to do so. The pair failed to start a bearish correction normally, unlike the pound, and today, considering the movements of the last weeks, it will be very difficult to predict the market's reaction to the inflation report. It is better to say that with a high probability the market will try to interpret the report in favor of the euro again. If inflation is falling, that's bad for the dollar. If inflation is falling slowly or not at all, it's good for the dollar. Accordingly, inflation should slow down very weakly in December for the market to start buying the dollar. In other cases, the pair's growth is more likely.

All of the trading signals of the day were formed near 1.0736 and all of them were not accurate, but what else should we expect from the signals during the flat? Traders could try to use only the first two, but there was not even 15-point movement in the right direction neither in the first, nor in the second case, so both trades could make the loss. Unfortunately, yesterday it was impossible to avoid it.

COT report

This image is no longer relevant

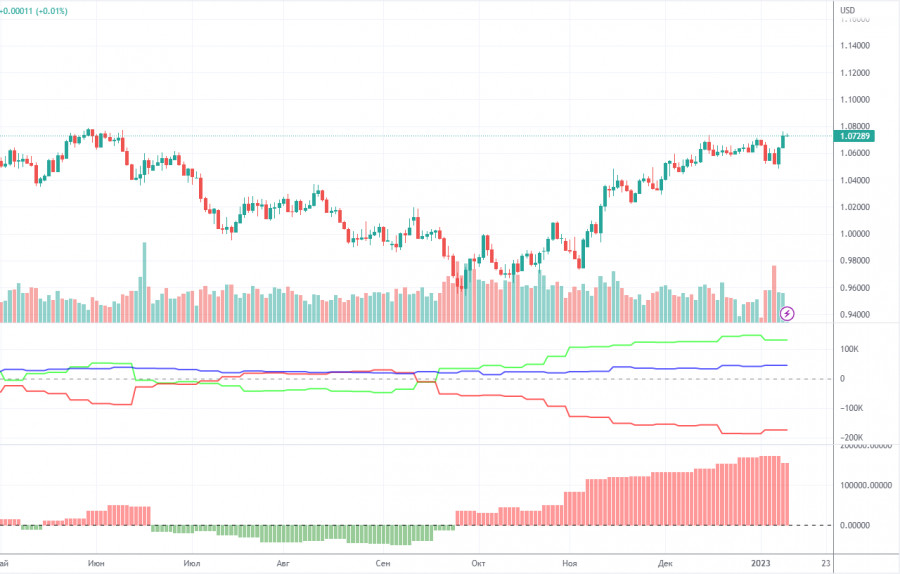
The COT reports for the euro in the last few months have been fully consistent with what is happening in the market. You can clearly see on the chart that the net position of big players (the second indicator) has been growing since early September. Around the same time, the euro started to grow. At this time, the net position of the non-commercial traders has been bullish and strengthens almost every week, but it is a rather high value that allows us to assume that the upward movement will end soon. Notably, the green and red lines of the first indicator have moved far apart from each other, which often means the end of the trend. During the given period, the number of long positions held by non-commercial traders decreased by 29,300, whereas the number of short positions fell by 13,100. Thus, the net positions decreased by 16,200. The number of long positions is 130,000 higher than the number of short positions opened by non-commercial traders. So the question now is how long will the big players increase their longs? Moreover, from a technical perspective, a bearish correction should have started a long time ago. In my opinion, this process can not continue for another 2 or 3 months. Even the net position indicator shows that we need to "unload" a bit, that is, to correct. The overall number of short orders exceeds the number of long orders by 44,000 (671,000 vs. 627,000).

H1 chart of EUR/USD

This image is no longer relevant

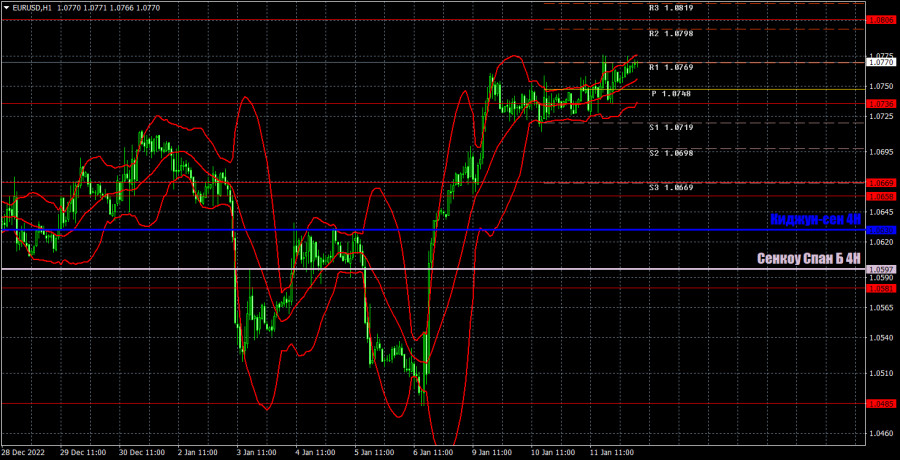
On the one-hour chart, EUR/USD continues the upward movement, which started last Friday. Yes, it has weakened, but it still continues even without a local correction. It might do the same thing today, if the US inflation data shows a slowdown as expected. On Thursday, the pair may trade at the following levels: 1.0485, 1.0581, 1.0658-1.0669, 1.0736, 1.0806, 1.0938, 1.1036, as well as Senkou Span B (1.0597) and Kijun-sen (1.0630). Lines of the Ichimoku indicator may move during the day, which should be taken into account when determining trading signals. There are also support and resistance levels, but signals are not formed near these levels. Bounces and breakouts of the extreme levels and lines could act as signals. Don't forget about stop-loss orders, if the price covers 15 pips in the right direction. This will prevent you from losses in case of a false signal. On January 12, the US will publish its inflation report. Meanwhile, the EU's calendar of events is empty. So everyone will focus on the inflation data.

What we see on the trading charts:

Price levels of support and resistance are thick red lines, near which the movement may end. They do not provide trading signals.

The Kijun-sen and Senkou Span B lines are the lines of the Ichimoku indicator, moved to the one-hour chart from the 4-hour one. They are strong lines.

Extreme levels are thin red lines from which the price bounced earlier. They provide trading signals.

Yellow lines are trend lines, trend channels, and any other technical patterns.

Indicator 1 on the COT charts reflects the net position size of each category of traders.

Indicator 2 on the COT charts reflects the net position size for the non-commercial group.

Paolo Greco,
Chuyên gia phân tích của InstaForex
© 2007-2025
Summary
Urgency
Analytic
Stanislav Polyanskiy
Start trade
Kiếm lợi nhuận từ những biến đổi giá của tiền điện tử với InstaForex.
Tải MetaTrader 4 và mở giao dịch đầu tiên của bạn.
  • Grand Choice
    Contest by
    InstaForex
    InstaForex always strives to help you
    fulfill your biggest dreams.
    THAM GIA CUỘC THI

Các bài báo được đề xuất

Cách giao dịch cặp tiền GBP/USD vào ngày 11 tháng 8? Mẹo đơn giản và phân tích giao dịch cho người mới bắt đầu

Cặp tiền GBP/USD tiếp tục xu hướng tăng vào thứ Sáu. Sự di chuyển này vô cùng yếu, với tổng biến động trong ngày chỉ đạt 43 pip. Không

Paolo Greco 06:00 2025-08-11 UTC+2

Cách giao dịch cặp EUR/USD vào ngày 11 tháng 8? Mẹo đơn giản và phân tích giao dịch cho người mới bắt đầu

Vào thứ Sáu, cặp tiền tệ EUR/USD giao dịch hoàn toàn không đổi. Không có báo cáo kinh tế vĩ mô nào được lên lịch cho ngày

Paolo Greco 06:00 2025-08-11 UTC+2

Khuyến nghị giao dịch và phân tích giao dịch cho GBP/USD vào ngày 11 tháng 8: Đồng Bảng Anh nằm ở mức thấp nhưng vẫn giữ vững vị thế

Vào thứ Sáu, cặp tiền tệ GBP/USD cũng không có biến động nổi bật nào. Tuy nhiên, một sự điều chỉnh cũng không bắt đầu - đồng bảng

Paolo Greco 03:35 2025-08-11 UTC+2

Khuyến nghị giao dịch và phân tích giao dịch cho EUR/USD vào ngày 11 tháng 8: Di chuyển ổn định và ba tín hiệu tuyệt vời

Vào ngày thứ Sáu, cặp tỷ giá EUR/USD giao dịch theo hướng đi ngang. Không có bối cảnh kinh tế vĩ mô nào vào ngày đó, và dường

Paolo Greco 03:35 2025-08-11 UTC+2

Cách giao dịch cặp GBP/USD vào ngày 8 tháng 8? Mẹo đơn giản và phân tích giao dịch cho người mới bắt đầu

Cặp GBP/USD tiếp tục xu hướng tăng suốt cả ngày thứ Năm. Ngày hôm qua, Ngân hàng Anh đã quyết định cắt giảm lãi suất chủ chốt

Paolo Greco 06:58 2025-08-08 UTC+2

Cách giao dịch cặp EUR/USD vào ngày 8 tháng 8? Mẹo đơn giản và phân tích giao dịch cho người mới bắt đầu

Cặp tiền tệ EUR/USD đã giảm nhẹ vào thứ Năm, nhưng mức giảm là rất nhỏ và không kéo dài. Về cơ bản, đồng đô la vẫn chưa

Paolo Greco 06:58 2025-08-08 UTC+2

Khuyến nghị giao dịch và phân tích giao dịch cho GBP/USD vào ngày 8 tháng 8: Ngân hàng Anh kích thích tăng trưởng

Vào thứ Năm, cặp tiền tệ GBP/USD tiếp tục đà tăng. Ngân hàng Trung ương Anh cuối cùng đã quyết định cắt giảm lãi suất chủ chốt của mình, nhưng

Paolo Greco 03:31 2025-08-08 UTC+2

Khuyến nghị giao dịch và phân tích giao dịch cho EUR/USD vào ngày 8 tháng 8: Sự điều chỉnh trước khi tăng mới

Vào thứ Năm, cặp tiền tệ EUR/USD đã trải qua một đợt điều chỉnh giảm nhẹ trong khuôn khổ của xu hướng tăng mới trên khung thời gian hàng

Paolo Greco 03:31 2025-08-08 UTC+2

Làm thế nào để giao dịch cặp GBP/USD vào ngày 7 tháng 8? Mẹo đơn giản và phân tích giao dịch cho người mới bắt đầu

Cặp tiền tệ GBP/USD cũng tiếp tục xu hướng tăng vào thứ Tư, vì cùng lý do với cặp EUR/USD. Donald Trump tiếp tục sa thải các quan chức

Paolo Greco 06:18 2025-08-07 UTC+2

Làm thế nào để giao dịch cặp EUR/USD vào ngày 7 tháng 8? Mẹo đơn giản và phân tích giao dịch cho người mới bắt đầu

Cặp tiền tệ EUR/USD đã tiếp tục xu hướng tăng vào thứ Tư, đúng như chúng tôi đã cảnh báo. Thoạt nhìn, có vẻ thị trường không

Paolo Greco 06:18 2025-08-07 UTC+2
Không thể nói chuyện ngay bây giờ?
Đặt câu hỏi của bạn trong phần trò chuyện.
Widget callback
 

Dear visitor,

Your IP address shows that you are currently located in the USA. If you are a resident of the United States, you are prohibited from using the services of InstaFintech Group including online trading, online transfers, deposit/withdrawal of funds, etc.

If you think you are seeing this message by mistake and your location is not the US, kindly proceed to the website. Otherwise, you must leave the website in order to comply with government restrictions.

Why does your IP address show your location as the USA?

  • - you are using a VPN provided by a hosting company based in the United States;
  • - your IP does not have proper WHOIS records;
  • - an error occurred in the WHOIS geolocation database.

Please confirm whether you are a US resident or not by clicking the relevant button below. If you choose the wrong option, being a US resident, you will not be able to open an account with InstaForex anyway.

We are sorry for any inconvenience caused by this message.