M5 chart of EUR/USD
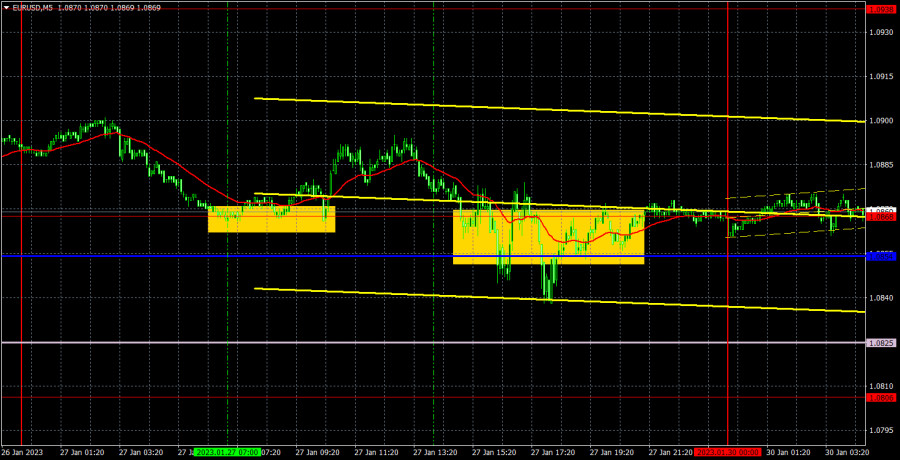
EUR/USD did not show any interesting movements on Friday. The price was striving for the critical line, and when it reached this line, it failed to overcome it. Thus, the flat pattern persisted and the price continued to move above the Ichimoku indicator lines (we registered them in the last "pre-flat" position), so there are no changes in the technical picture. There are reasons to expect that this week's trading will be very volatile, which suggests that the flat will end. But we have already analyzed this point in our fundamental articles. I think that the "signs" of all the forthcoming events are very serious, but the reaction to them may be quite different from what everyone expects. In other words, the outcome of the European Central Bank and Federal Reserve meetings has already been worked out "in advance" and if there are no surprises, the market reaction will be very restrained. I also expect the market to come to a conclusion that it is simply unreasonable to buy the euro.
Speaking of Friday's trading signals, it was difficult. During the European session, the pair showed a desire to move in a logical manner, so there was a buy signal near 1.0868. The position was closed using Stop Loss and we did not incur any loss because the price failed to reach the target level. At the US trading session, the pair started the "roller coaster ride" near the 1.0854-1.0868 area, which resulted in a whole series of false signals. Traders could have worked off one more, any signal, which surely closed in a loss.
COT report
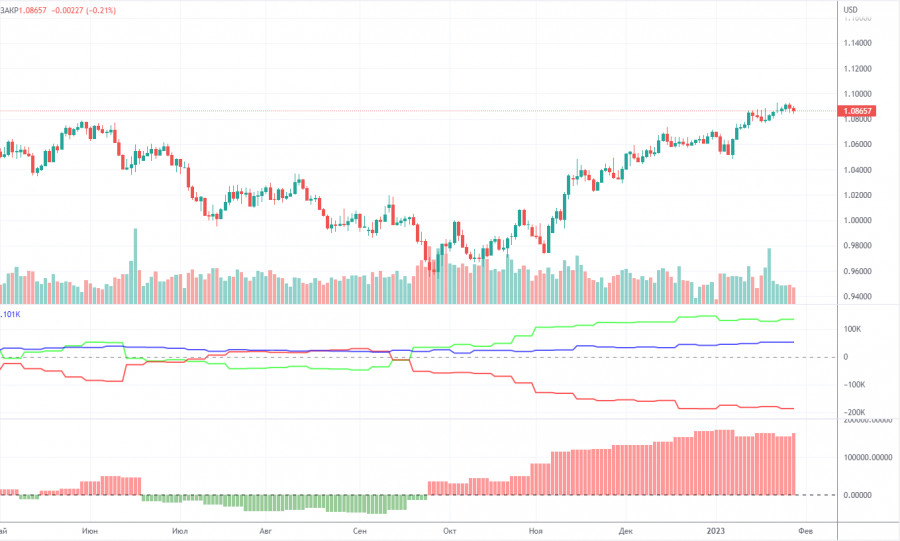
The COT reports for the euro in the last few months have been fully consistent with what is happening in the market. You can clearly see on the chart that the net position of big players (the second indicator) has been growing since early September. Around the same time, the euro started to grow. At this time, the net position of the non-commercial traders has been bullish and strengthens almost every week, but it is a rather high value that allows us to assume that the uptrend will end soon. Notably, the green and red lines of the first indicator have moved far apart from each other, which often precedes the end of the trend. During the given period, the number of long positions held by non-commercial traders decreased by 9,500, whereas the number of short positions fell by 2,000. Thus, the net positions decreased by 7,500. Now the number of long positions is higher than the number of short positions opened by non-commercial traders by 134,000. So now the question is: how long will the big players increase their longs? From a technical perspective, a bearish correction should have started a long time ago. In my opinion, this process can not continue for another 2 or 3 months. Even the net position indicator shows that we need to "unload" a bit, that is, to correct. The overall number of short orders exceeds the number of long orders by 52,000 (732,000 vs. 680,000).
H1 chart of EUR/USD
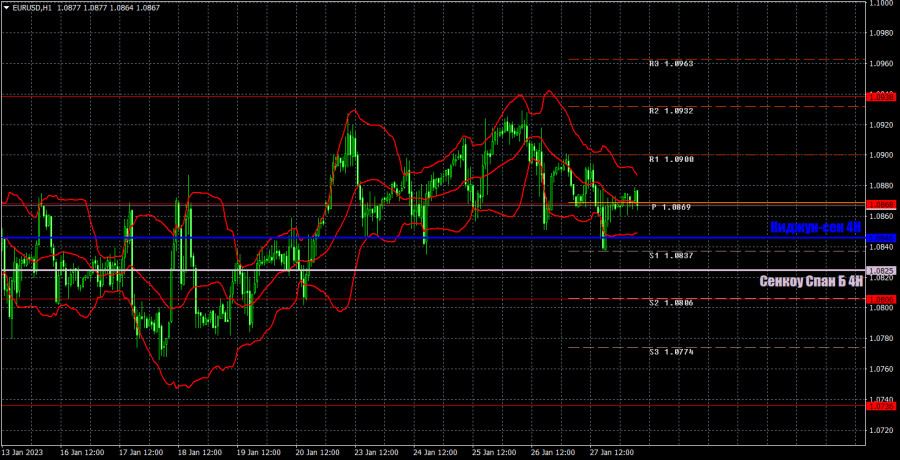
The technical picture on the one-hour chart remains unchanged. We can see that the pair maintains the bullish sentiment, and is located above the lines of the Ichimoku indicator. However, the pair was mostly flat, whether there was macro data or not. Thus, the euro can not rise, but it doesn't want to fall as well. This week, traders will have enough reasons to end the flat. On Monday, the pair may trade at the following levels: 1.0658-1.0669, 1.0736, 1.0806, 1.0868, 1.0938, 1.1036, 1.1137 and also Senkou Span B lines (1.0825) and Kijun Sen (1.0846). Lines of the Ichimoku indicator may move during the day, which should be taken into account when determining trading signals. There are also support and resistance levels, but signals are not formed near these levels. Bounces and breakouts of the extreme levels and lines could act as signals. Don't forget about stop-loss orders, if the price covers 15 pips in the right direction. This will prevent you from losses in case of a false signal. On January 30, there are no important and interesting events planned in the European Union and the United States, all the most interesting events and reports will be found in the second half of the week.
What we see on the trading charts:
Price levels of support and resistance are thick red lines, near which the movement may end. They do not provide trading signals.
The Kijun-sen and Senkou Span B lines are the lines of the Ichimoku indicator, moved to the one-hour chart from the 4-hour one. They are strong lines.
Extreme levels are thin red lines from which the price bounced earlier. They provide trading signals.
Yellow lines are trend lines, trend channels, and any other technical patterns.
Indicator 1 on the COT charts reflects the net position size of each category of traders.
Indicator 2 on the COT charts reflects the net position size for the non-commercial group.


