Analysis of EUR/USD 5M.
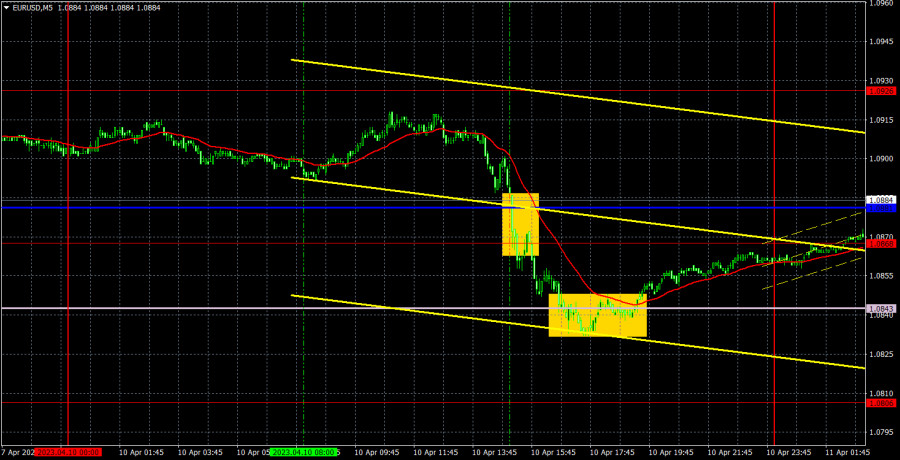
During the first trading day of the week, the currency pair EUR/USD resumed its decline. Since no significant events or reports were planned for Easter Monday, we do not doubt that the market was reacting to Friday's US statistics. Recall that the nonfarm payrolls generally met the forecasted values and came out at a pretty good level, while unemployment even decreased, despite all fears of its acceleration. Thus, the Friday statistics package can be called strong, but the dollar grew very weak due to the semi-holiday status of the day. On Monday, traders processed this data, but the dollar grew weakly. A couple of hours after the completion of the decline to the Senkou Span B line (which, by the way, was located very close to the price), growth began, and at the moment, the euro has almost completely offset the losses. Once again, it can be said that the dollar grew too weakly and does not generally want to grow, while the euro, on the contrary, easily holds its position even when it should objectively fall.
There were few trading signals on Monday. The Senkou Span B and Kijun-sen lines were very close, and level 1.0868 was between them. Thus, after overcoming one line, the price immediately appeared near the next one. Therefore, there needed to be more sense in processing these signals. Moreover, the pair is reluctant to fall and fails to overcome the Senkou Span B line.
COT Report:
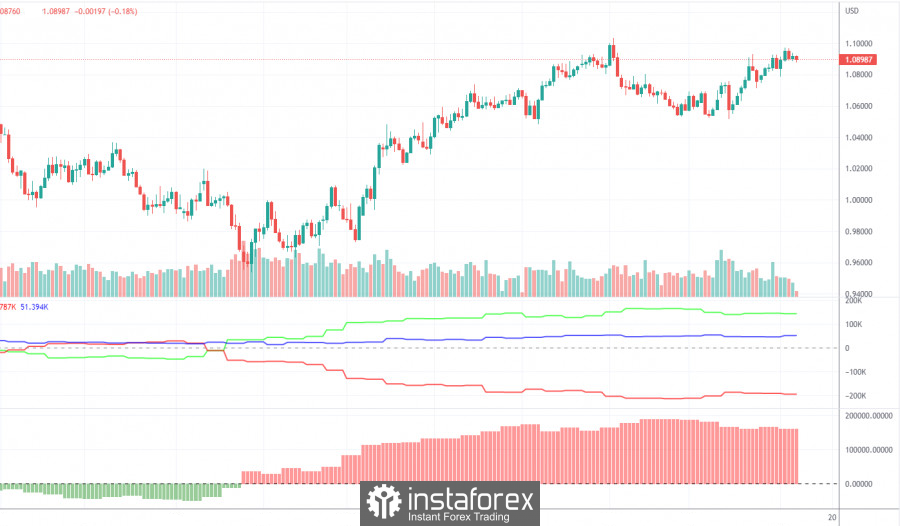
A new COT report for April 4th was released on Friday. The CFTC has caught up on lost time and publishes reports corresponding to the current period. Over the past few months, the picture has fully corresponded to what has been happening in the market. The illustration above clearly shows that the net position of large players (the second indicator) has been growing since September 2022. Around the same time, the European currency began to grow. Currently, the net position of non-commercial traders remains "bullish" and very high, as do the positions of the European currency, which can't properly correct down. We have already drawn traders' attention to the fact that a rather high value of the "net position" allows for the imminent completion of the upward trend. The first indicator, on which the red and green lines have moved far apart, often signals this before the trend's end. The European currency tried to start falling, but so far, we have only seen a trivial rollback downwards. During the last reporting week, the number of buy contracts in the "non-commercial" group increased by 2.5 thousand, and the number of shorts increased by 4.1 thousand. Accordingly, the net position has mostly stayed the same. The number of buy contracts is higher than that of sell contracts among non-commercial traders by 143 thousand. The correction is still brewing, so even without COT reports, it is clear that the pair should resume its decline.
Analysis of EUR/USD 1H.
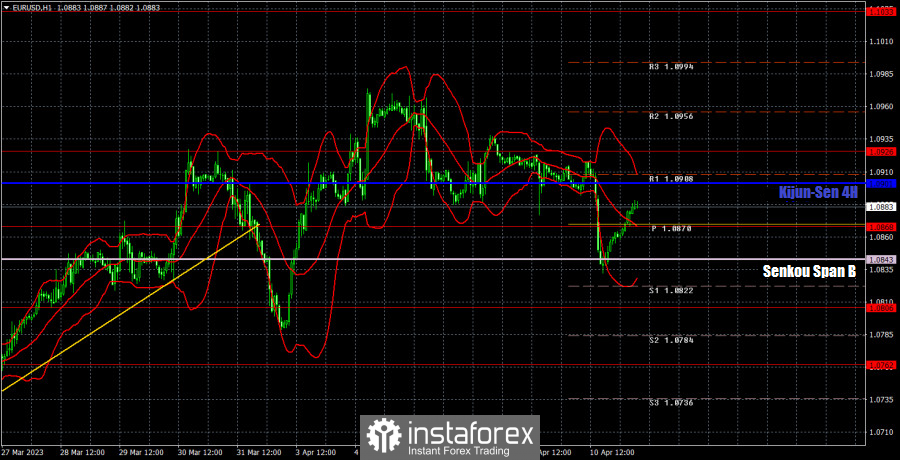
On the hourly timeframe, the pair maintains an upward trend without a new trend line. The growth of the European currency can resume at any moment, even without significant reasons. Only fixing the price below the Ichimoku indicator lines will allow for consideration of starting a downward trend on the hourly TF. Still, there are serious difficulties with this, although both lines are near. Traders still desperately do not want to sell; without sales, we will not see a correction again. For Tuesday, we highlight the following levels for trading - 1.0581, 1.0658-1.0669, 1.0762, 1.0806, 1.0868, 1.0926, 1.1033, 1.1137-1.1185, 1.1234, 1.1274, as well as the Senkou Span B (1.0843) and Kijun-sen (1.0901) lines. The Ichimoku indicator lines may move during the day, which should be considered when determining trading signals. There are also auxiliary support and resistance levels, but no signals are formed near them. Signals can "bounce" and "overcome" extreme levels and lines. Remember to set the stop-loss order without loss if the price has gone in the right direction by 15 points. This will protect against possible losses if the signal turns out to be false. On April 11th, the European Union will publish a report on retail sales, which can hardly be called important now and is not expected to impact traders' sentiment significantly. And there will be no other events or publications today.
Explanations for illustrations:
Price support and resistance levels - thick red lines around which the movement can end. They are not sources of trading signals.
Kijun-sen and Senkou Span B lines - Ichimoku indicator lines transferred to the hourly timeframe from the 4-hour. They are strong lines.
Extreme levels - thin red lines from which the price previously bounced. They are sources of trading signals.
Yellow lines - trend lines, channels, and other technical patterns.
Indicator 1 on COT charts - the size of the net position for each category of traders.
Indicator 2 on COT charts - the size of the net position for the "Non-commercial" group.


