5M chart of GBP/USD
The GBP/USD pair traded poorly on Tuesday. On the hourly chart, the movement looks quite good, but on the 5-minute chart, we see constant corrections and intraday retracements. Plenty of Ichimoku indicator lines and levels did not allow the price to move calmly and in one direction. In addition, two fairly important reports were published in the UK and the US. Therefore, there were too many factors (technical and macroeconomic) affecting the pair's movement. The price constantly reversed and changed direction, which greatly complicated the trading process. Nevertheless, at the end of the day, the pound edged down again, but it was so insignificant that it is impossible to conclude that a downtrend is forming. Especially ahead of the Federal Reserve meeting and nonfarm payroll and unemployment data in the US on Friday.
In principle, most of Tuesday's trading signals are not even worth considering. All trading signals formed between the 1.2429 level and the critical Kijun-sen line should not have been executed, as in each case, the nearest target was located a maximum of 20-30 points away. At the moment, when the signal was formed, the price was almost immediately at the target. Therefore, traders could have tried to execute the first buy signal at most. The pair could not even rise 20 points, so there was a loss after consolidating below the Kijun-sen line. There was no need to be active.
COT report:
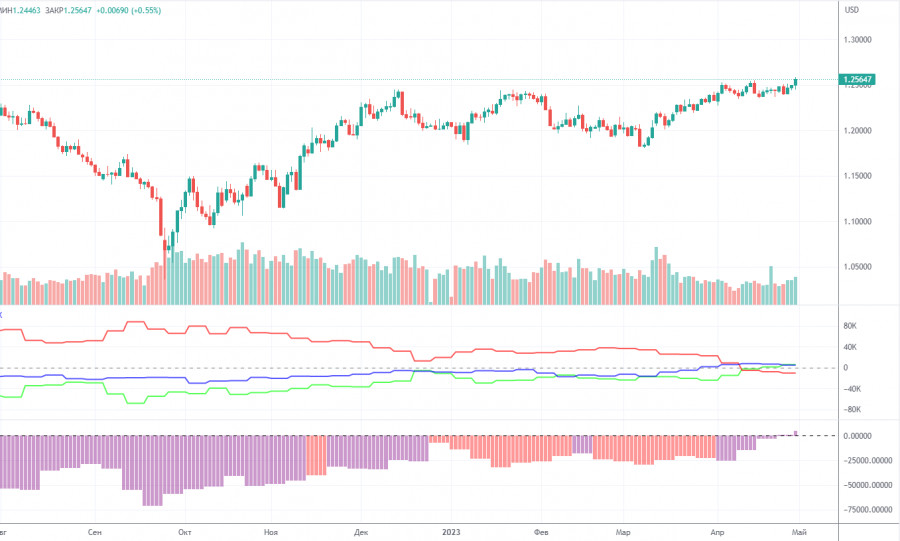
According to the latest COT report on the British pound, the non-commercial group of traders opened 5,600 long positions and 1,000 shorts. As a result, the net position of the non-commercial group traders has increased by 4,600 and continues to grow. The net position has been steadily rising for the past 8-9 months, but the sentiment of major market players remained bearish during this time. Now it can be called bullish to some extent. Although the British pound is strengthening against the US dollar in the medium term, it is hard to explain this behavior from the fundamental point of view. There is still the possibility of a sharp decline in the pound. Both major pairs are moving in a similar way now, but the net position of the euro is positive and even implies the imminent completion of the upward momentum, while for the pound, it still suggests further growth. The British currency has already risen by more than 2,100 points, which is a lot, and without a strong bearish correction, the continuation of growth would be absolutely illogical. The non-commercial group of traders currently has a total of 53,500 shorts and 59,500 longs. I remain skeptical about the long-term growth of the British currency and expect it to decline.
1H chart of GBP/USD
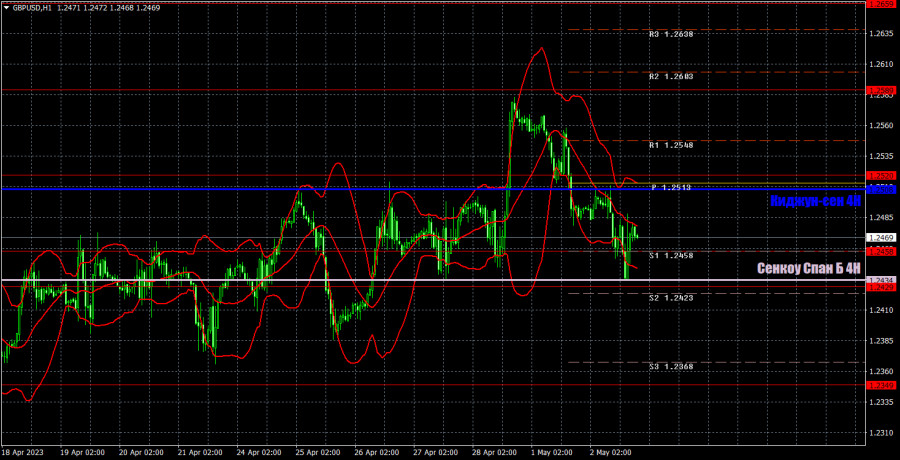
On the one-hour chart, the GBP/USD pair is trading on the "swings." The pound failed to show a significant decline after overcoming another ascending trend line. At this time, we can already form the fourth ascending trend line, which doesn't mean anything, as overcoming these lines still does not lead to a decline. In the short term, the pair continues to alternate between downturns and upturns, ignoring all incoming information. For May 3, we highlight the following important levels: 1.2185, 1.2269, 1.2349, 1.2429-1.2458, 1.2520, 1.2589, 1.2659, 1.2762. The Senkou Span B (1.2434) and Kijun-sen (1.2508) lines can also generate signals. Rebounds and breakouts from these lines can also serve as trading signals. It is better to set the Stop Loss at breakeven as soon as the price moves by 20 pips in the right direction. The lines of the Ichimoku indicator can change their position throughout the day which is worth keeping in mind when looking for trading signals. On the chart, you can also see support and resistance levels where you can take profit. The UK will not release any macro data on Wednesday. Meanwhile, at least one important report will be released in the US - the ISM business activity index for the services sector. In the evening, we have the Federal Reserve meeting, and Chairman Jerome Powell's press conference. We will almost certainly see a spike in volatility, but the pair may simply alternate between both directions.
Indicators on charts:
Resistance/support - thick red lines, near which the trend may stop. They do not make trading signals.
Kijun-sen and Senkou Span B are the Ichimoku indicator lines moved to the hourly timeframe from the 4-hour timeframe. They are also strong lines.
Extreme levels are thin red lines, from which the price used to bounce earlier. They can produce trading signals.
Yellow lines are trend lines, trend channels, and any other technical patterns.
Indicator 1 on the COT chart is the size of the net position of each trader category.
Indicator 2 on the COT chart is the size of the net position for the Non-commercial group of traders.


