empty
22.09.2023 05:05 AM
Trading plan for GBP/USD on September 22. Simple tips for beginners

Analyzing Thursday's trades:

GBP/USD on 30M chart

This image is no longer relevant

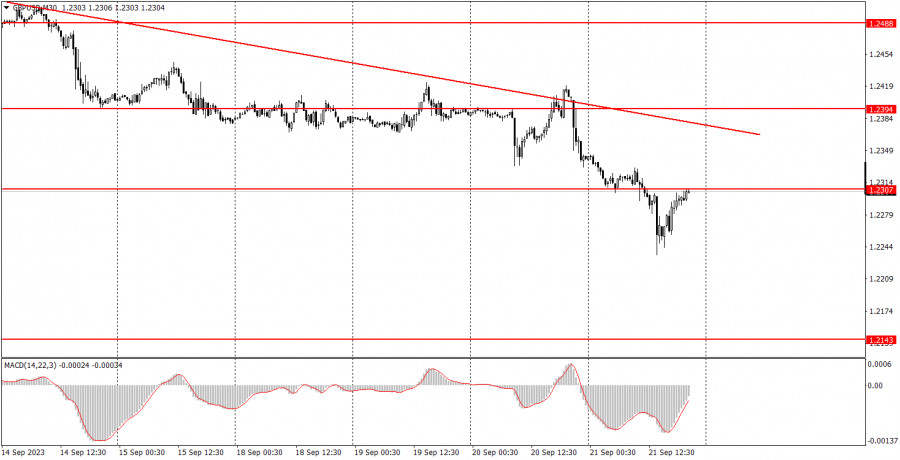
On Thursday, GBPUSD continued its negative trading for most of the day. There were quite specific reasons for this – the Bank of England announced that it kept the policy rate unchanged, although most market participants were expecting another hike. However, five members of the Monetary Policy Committee voted "against" the rate hike, and that was the minimum number of votes required to make such a decision. During the press conference, it was stated that the BoE is not putting an end to the tightening cycle but believes that the rate is already at a sufficiently restrictive level, so additional tightening is not required at this time. We believe that after such information, it was quite logical for the pound to fall.

Afterwards, the British currency did manage to continue its corrective move higher, but this doesn't change anything. The fundamental backdrop for the British currency has become even worse, so in the medium term, we expect it to continue its downward movement. The pound continues to lose bullish indicators. The downtrend line remains relevant.

GBP/USD on 5M chart

This image is no longer relevant

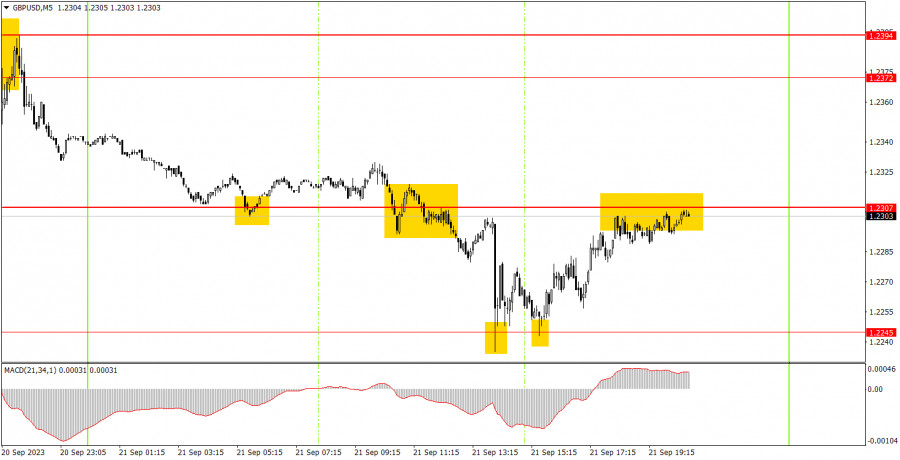
There were a good amount of trading signals on the 5-minute chart, but the nature of the movement was far from ideal. This was due to the "emotional storm" that erupted after the BoE meeting. However, there were two signals formed around the level of 1.2387 before the results were announced. First, the pair bounced off this level but failed to move in the right direction by 20 pips. Then, a sell signal was formed, but it should not have been executed due to the proximity of the BOE meeting. Bounces from the level of 1.2245 could already be executed, and these signals, duplicating each other, allowed for a profit of about 35 pips. But due to the initial losing trade, the profit was quite small.

Trading tips on Friday:

On the 30-minute chart, GBP/USD has experienced two challenging days, with the downtrend still in place and the fundamental backdrop turning worse for the British currency. Therefore, it may enter a bullish correction in the near future, but in the long run, we expect the pound to continue falling. The key levels on the 5M chart are 1.2143, 1.2171-1.2179, 1.2245, 1.2307, 1.2372-1.2394, 1.2457-1.2488, 1.2544, 1.2605-1.2620, 1.2653, 1.2688. Once the price moves 20 pips in the right direction after opening a trade, you can set the stop-loss at breakeven. On Friday, traders now look to the release of the UK and US Manufacturing and Services PMIs. The UK PMIs will be significant for the pound, but in the US, the ISM PMIs are more important.

Basic trading rules:

1) The strength of the signal depends on the time period during which the signal was formed (a rebound or a break). The shorter this period, the stronger the signal.

2) If two or more trades were opened at some level following false signals, i.e. those signals that did not lead the price to Take Profit level or the nearest target levels, then any consequent signals near this level should be ignored.

3) During the flat trend, any currency pair may form a lot of false signals or do not produce any signals at all. In any case, the flat trend is not the best condition for trading.

4) Trades are opened in the time period between the beginning of the European session and until the middle of the American one when all deals should be closed manually.

5) We can pay attention to the MACD signals in the 30M time frame only if there is good volatility and a definite trend confirmed by a trend line or a trend channel.

6) If two key levels are too close to each other (about 5-15 pips), then this is a support or resistance area.

How to read charts:

Support and Resistance price levels can serve as targets when buying or selling. You can place Take Profit levels near them.

Red lines are channels or trend lines that display the current trend and show which direction is better to trade.

MACD indicator (14,22,3) is a histogram and a signal line showing when it is better to enter the market when they cross. This indicator is better to be used in combination with trend channels or trend lines.

Important speeches and reports that are always reflected in the economic calendars can greatly influence the movement of a currency pair. Therefore, during such events, it is recommended to trade as carefully as possible or exit the market in order to avoid a sharp price reversal against the previous movement.

Beginners should remember that every trade cannot be profitable. The development of a reliable strategy and money management are the key to success in trading over a long period of time.

Paolo Greco,
Chuyên gia phân tích của InstaForex
© 2007-2025
Chọn khung thời gian
5
phút
15
phút
30
phút
1
giờ
4
ngày
1
ngày
1
tuần
Kiếm lợi nhuận từ những biến đổi giá của tiền điện tử với InstaForex.
Tải MetaTrader 4 và mở giao dịch đầu tiên của bạn.
  • Grand Choice
    Contest by
    InstaForex
    InstaForex always strives to help you
    fulfill your biggest dreams.
    THAM GIA CUỘC THI

Các bài báo được đề xuất

Cách giao dịch cặp GBP/USD vào ngày 23 tháng 5? Mẹo đơn giản và phân tích giao dịch cho người mới bắt đầu

Cặp tiền tệ GBP/USD thậm chí không cố gắng điều chỉnh vào thứ Năm. Trong khi đồng euro phải đối mặt với áp lực giảm do chỉ số hoạt động

Paolo Greco 05:58 2025-05-23 UTC+2

Cách giao dịch cặp tiền tệ EUR/USD vào ngày 23 tháng 5? Mẹo đơn giản và phân tích giao dịch cho người mới bắt đầu

Vào thứ Năm, cặp tiền tệ EUR/USD đã điều chỉnh về mức hỗ trợ gần nhất trên khung thời gian giờ, nằm ở mức 1.1267. Nhiều

Paolo Greco 05:57 2025-05-23 UTC+2

Khuyến nghị và Phân tích Giao dịch GBP/USD vào ngày 23 tháng 5: Đồng Bảng Anh Chuẩn Bị Cho Một Đột Phá Lịch Sử

Cặp tiền tệ GBP/USD đã bứt phá khỏi kênh đi ngang qua biên trên, nhưng chưa vội tiếp tục tăng. Có vẻ như các nhà giao dịch đang

Paolo Greco 03:43 2025-05-23 UTC+2

Khuyến nghị giao dịch và phân tích EUR/USD ngày 23 tháng 5: Đồng Euro không thể chịu nổi áp lực

Vào thứ Năm, cặp tiền tệ EUR/USD giao dịch giảm, điều này có thể được xem như một ngoại lệ trong xu hướng chung

Paolo Greco 03:43 2025-05-23 UTC+2

Cách giao dịch cặp GBP/USD vào ngày 22 tháng 5? Mẹo đơn giản và phân tích giao dịch cho người mới bắt đầu

Cặp tiền GBP/USD tiếp tục giữ xu hướng tăng vào thứ Tư, một xu hướng đã phát triển trong hai tuần qua. Nhớ lại rằng đợt tăng sức mạnh đồng

Paolo Greco 06:31 2025-05-22 UTC+2

Làm thế nào để giao dịch cặp EUR/USD vào ngày 22 tháng 5? Mẹo đơn giản và phân tích giao dịch cho người mới bắt đầu

Vào thứ Tư, cặp tiền tệ EUR/USD tiếp tục di chuyển lên một cách bình tĩnh và ổn định. Giá đã bứt phá qua mức 1.1267, một mức mà trước

Paolo Greco 06:31 2025-05-22 UTC+2

Khuyến nghị và Phân tích Giao dịch cho GBP/USD vào ngày 22 tháng 5: Đồng Bảng Anh Phá Vỡ Các Mức Quan Trọng

Cặp tiền tệ GBP/USD cũng tiếp tục đà tăng vào thứ Tư. Sự tăng giá của đồng bảng Anh, thực chất là sự suy yếu của đồng

Paolo Greco 03:30 2025-05-22 UTC+2

Khuyến nghị và Phân tích Giao dịch cho EUR/USD vào ngày 22 tháng 5: Lý do Không Quan Trọng và Không Cần Thiết

Cặp tiền tệ EUR/USD đã tiếp tục xu hướng tăng vào thứ Tư, và giờ có thể nói rằng xu hướng tăng hiện diện không chỉ trong khung thời gian

Paolo Greco 03:30 2025-05-22 UTC+2

Cách giao dịch cặp GBP/USD vào ngày 21 tháng 5? Mẹo đơn giản và phân tích giao dịch dành cho người mới bắt đầu

Cặp GBP/USD chủ yếu dao động trong biên độ ngang vào thứ Ba, nhưng sáng sớm thứ Tư nó đã tăng vọt. Trên biểu đồ 4 giờ, có thể thấy

Paolo Greco 06:17 2025-05-21 UTC+2

Làm thế nào để giao dịch cặp EUR/USD vào ngày 21 tháng 5? Mẹo đơn giản và phân tích giao dịch dành cho người mới bắt đầu

Vào thứ Ba, cặp tiền tệ EUR/USD giao dịch ngang, nhưng đã tiếp tục xu hướng tăng vào sáng sớm thứ Tư. Điều này cho thấy rằng xu hướng tăng

Paolo Greco 06:17 2025-05-21 UTC+2
Không thể nói chuyện ngay bây giờ?
Đặt câu hỏi của bạn trong phần trò chuyện.
Widget callback
 

Dear visitor,

Your IP address shows that you are currently located in the USA. If you are a resident of the United States, you are prohibited from using the services of InstaFintech Group including online trading, online transfers, deposit/withdrawal of funds, etc.

If you think you are seeing this message by mistake and your location is not the US, kindly proceed to the website. Otherwise, you must leave the website in order to comply with government restrictions.

Why does your IP address show your location as the USA?

  • - you are using a VPN provided by a hosting company based in the United States;
  • - your IP does not have proper WHOIS records;
  • - an error occurred in the WHOIS geolocation database.

Please confirm whether you are a US resident or not by clicking the relevant button below. If you choose the wrong option, being a US resident, you will not be able to open an account with InstaForex anyway.

We are sorry for any inconvenience caused by this message.