

signal strength 1 of 5

According to the chart of M5, #EBAY formed the Bullish Symmetrical Triangle pattern, which signals the trend will continue. Description. The upper border of the pattern touches the coordinates 67.70/67.05 whereas the lower border goes across 66.31/67.05. The pattern width is measured on the chart at 139 pips. If the Bullish Symmetrical Triangle pattern is in progress during the upward trend, this indicates the current trend will go on. In case 67.05 is broken, the price could continue its move toward 67.20.
The M5 and M15 time frames may have more false entry points.
- All
- Double Top
- Flag
- Head and Shoulders
- Pennant
- Rectangle
- Triangle
- Triple top
- All
- #AAPL
- #AMZN
- #Bitcoin
- #EBAY
- #FB
- #GOOG
- #INTC
- #KO
- #MA
- #MCD
- #MSFT
- #NTDOY
- #PEP
- #TSLA
- #TWTR
- AUDCAD
- AUDCHF
- AUDJPY
- AUDUSD
- EURCAD
- EURCHF
- EURGBP
- EURJPY
- EURNZD
- EURRUB
- EURUSD
- GBPAUD
- GBPCHF
- GBPJPY
- GBPUSD
- GOLD
- NZDCAD
- NZDCHF
- NZDJPY
- NZDUSD
- SILVER
- USDCAD
- USDCHF
- USDJPY
- USDRUB
- All
- M5
- M15
- M30
- H1
- D1
- All
- Buy
- Sale
- All
- 1
- 2
- 3
- 4
- 5
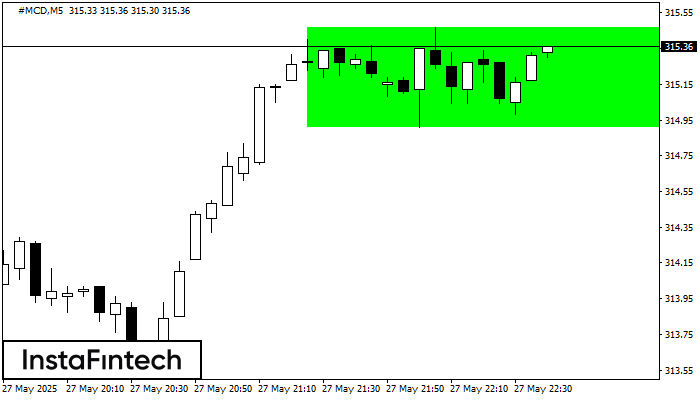
According to the chart of M5, #MCD formed the Bullish Rectangle. The pattern indicates a trend continuation. The upper border is 315.47, the lower border is 314.91. The signal means
The M5 and M15 time frames may have more false entry points.
Open chart in a new window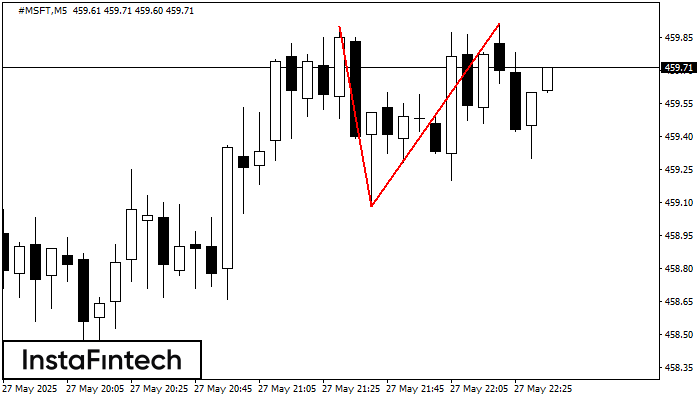
On the chart of #MSFT M5 the Double Top reversal pattern has been formed. Characteristics: the upper boundary 459.91; the lower boundary 459.08; the width of the pattern 83 points
The M5 and M15 time frames may have more false entry points.
Open chart in a new window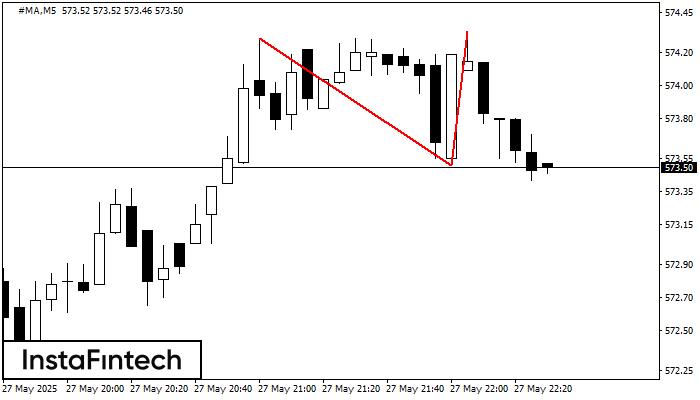
On the chart of #MA M5 the Double Top reversal pattern has been formed. Characteristics: the upper boundary 574.33; the lower boundary 573.51; the width of the pattern 82 points
The M5 and M15 time frames may have more false entry points.
Open chart in a new window


